STATS 2B03 Lecture Notes - Box Plot, Interquartile Range

19 Jun 2013
School
Department
Course
Professor
Document Summary
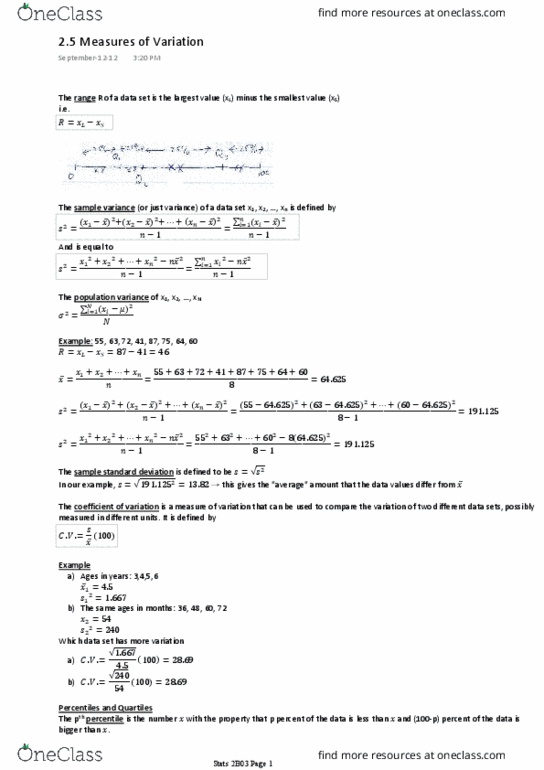
Measures of variation the coefficient of variation is a measure of variation that can be used to compare the variation of two different data sets, possibly measured in different units. Example: ages in years: 3, 4, 5, 6. X1avg=4. 5, s12=1. 667: the same ages in months: 36, 48, 60, 72. Which data set has more variation: same amount of variation just different units: c. v. =( 1. 667/4. 5)(100)=28. 69, c. v. =( 240/54)(100)=28. 69. Percentiles and quartiles the pth percentile is the number x with the property that p percent of the data is less than x and (100-p) percent of the data is bigger than x. E. g. the 50th percentile is the median the quartiles q1, q2, q3 divide the data set into roughly four equal parts, data set doesn"t have to be equally spaced, quartiles have to be equally spaced. E. g. 25%q4 where q2 is the median. Q1 is at position (n+1)/4 in ordered data set.