STATS 2B03 Lecture Notes - Pea, European Route E20

20 Jun 2013
School
Department
Course
Professor

Document Summary
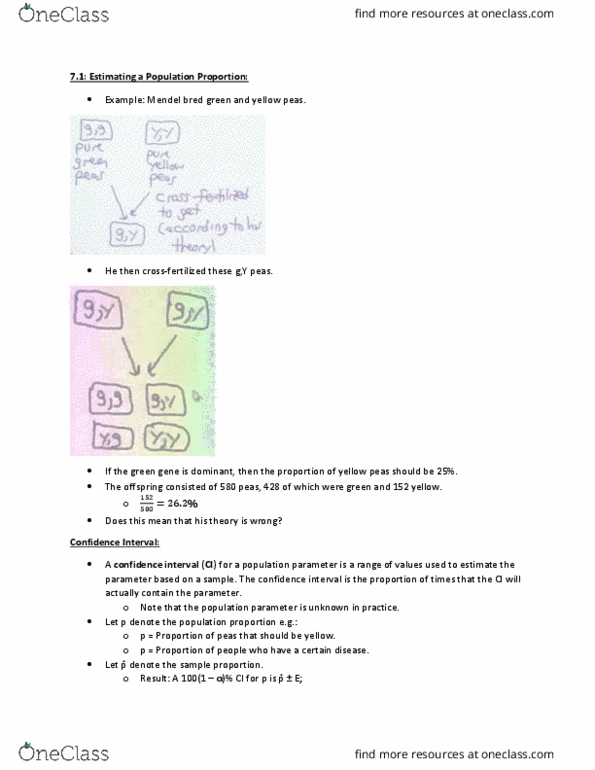
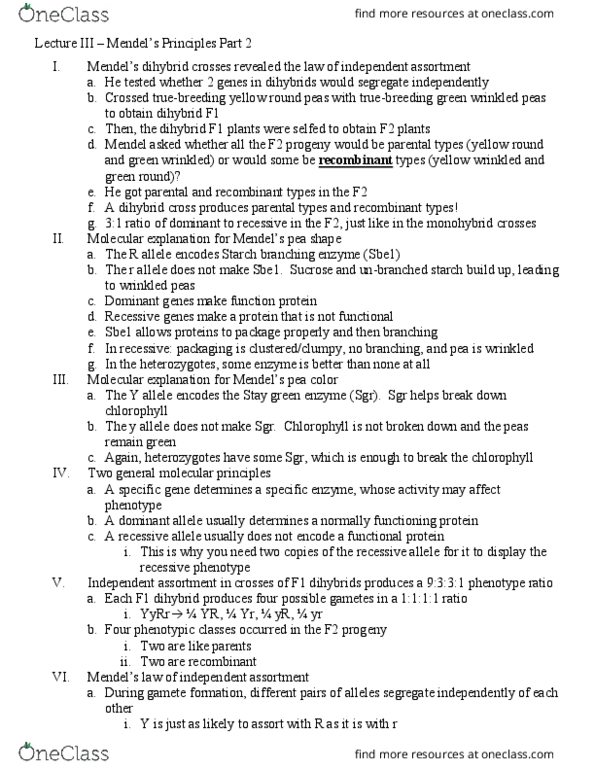
The chi-square distribution and the analysis of frequencies (1) see figure 9 in the courseware. There should be a similar amount of vertical variation for each of the four samples. Example: mendell bred green and yellow peas. G,g: pure green peas + y,y: pure yellow peas. Cross fertilized then to get (according to his theory): g,y. His theory was that the ywllow gene (y) is dominant over the green gene (g). he took 8023 of these g,y peas and cross-fertilized them. G,y + g,y: g,g; g,y; y,g; y,y. According to his theory p1= p(yellow pea) = , p2 = p(green pea) = . He observed 6022 yellow peas and 2001 green peas. In general we want to test whether an observed distribution of frequencies is consistent with some hypothesized distribution. In our example we want to test h0: p1= , p2= , ha: p1 , p2 .