GPHY 247 Lecture 4: STATS 4 Descriptive Statistics

17 Mar 2016
School
Department
Course
Professor
Document Summary
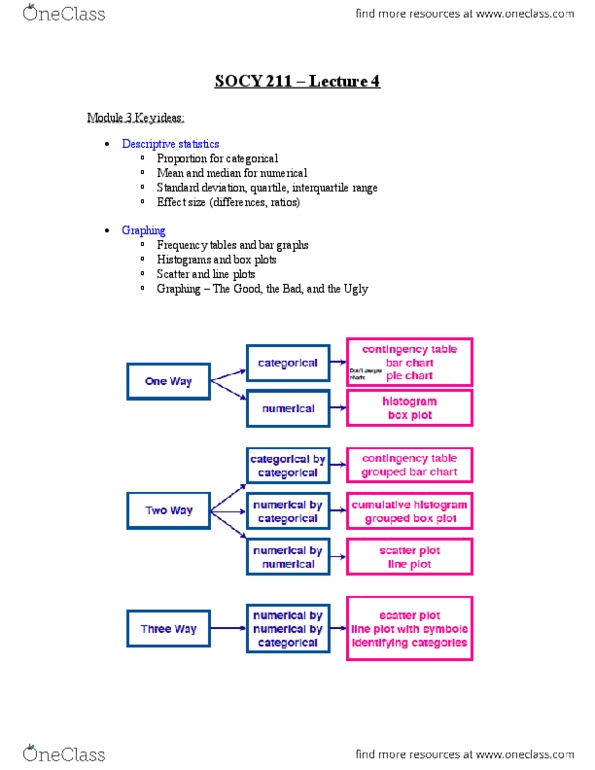
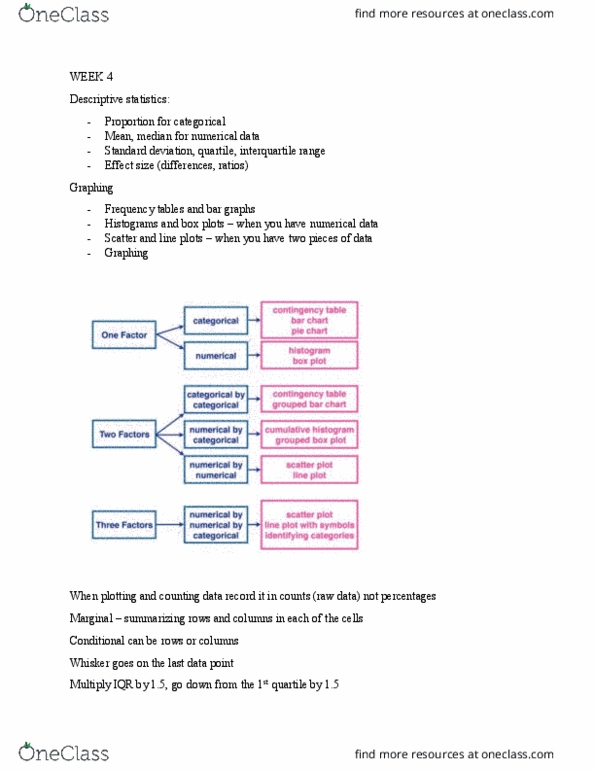
Module 3 key ideas: descriptive statistics. Case study: don"t throw me: number of scoring throws by weight class, sex and type of judo throw, marginal distribution as counts, whole numbers. Case study: wh is usain bolt so fast: race time, low to high, nd median =9. 93. Module 3: graphing: 3. 1 contingency tables (categorical) Contingency tables: one-way (columns), two-way (columns and rows: categorical data, marginal distributions to show the totals/sums. Can also be used to show proportions rather than total counts. Conditional distributions: dividing a cell by the total number from the same column, can also be used for rows. All cells will equal 100% with marginal distribution going the other way. conditional x/total from column: 3. 2 bar graphs (categorical) Bar charts: y=number, x=factor. space between each factor. Compound=primary group. space between primary group but not between gender. Monday, january 25, 2016: 3. 3 histograms (numerical vs. numerical) distributions. Histograms: plots of sorted and binned data.