ITM 107 Lecture Notes - Lecture 8: Sensitivity Analysis, Feasible Region, Shadow Price

28 Nov 2018
School
Department
Course
Professor
ITM 107 verified notes
8/13View all


Document Summary
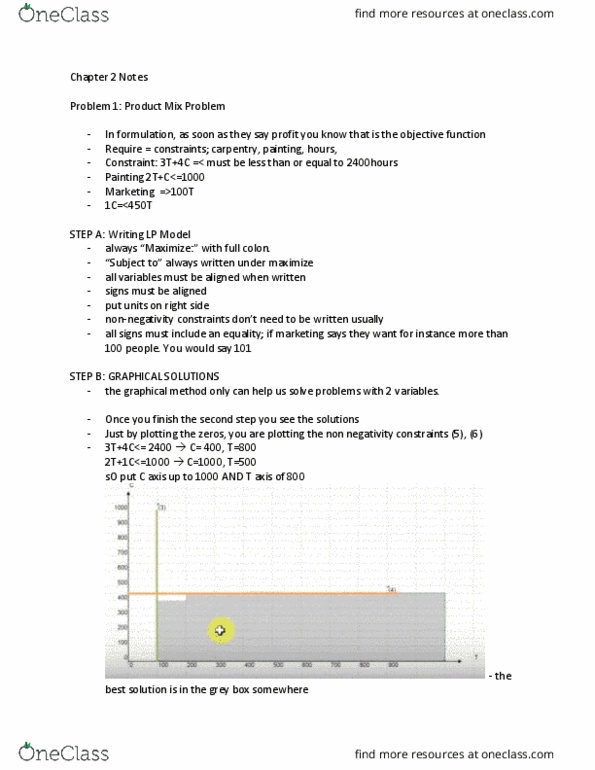
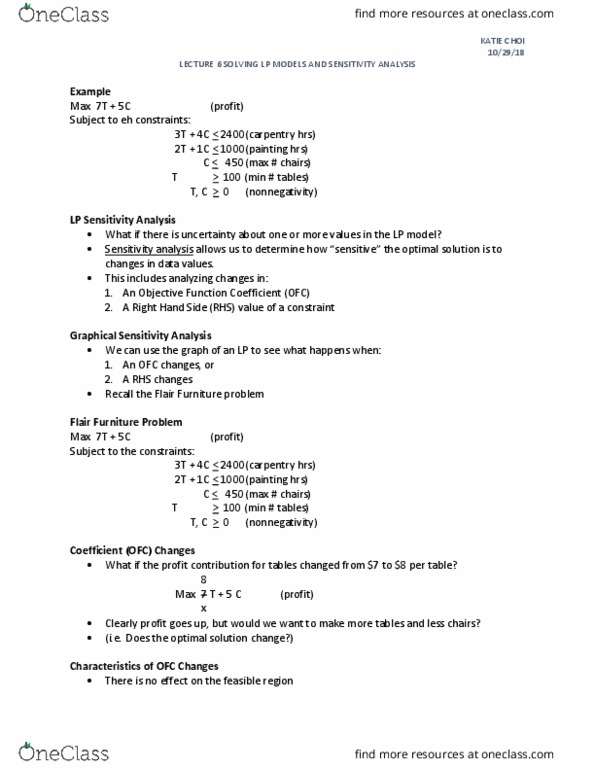
Graphical sensitivity analysis: we can use the graph of an lp to see what happens when, an ofc changes, or, a rhs changes, recall the flair furniture problem. Max 7 t + 5 c x (profit: clearly profit goes up, but would we want to make more tables and less chairs? (i. e. does the optimal solution change?) Characteristics of ofc changes: there is no effect on the feasible region. 10/29/18: the slope of the profit line changes. If the slope changes enough, a different corner point will become optimal. Optimal solution (t=200, c=450: there is a range for each ofc where the current optimal corner point remains optimal. If the ofc changes beyond that range, a new corner point becomes optimal. Finding the range of optimality: work on the board to find the range over which the optimal corner remains optimal. Max 7t + 5c c = -7/5 t + constant.