NUR 80A/B Lecture Notes - Lecture 4: Statistical Inference, Frequency Distribution, Central Tendency

27 Apr 2016
School
Department
Course
Professor
Document Summary
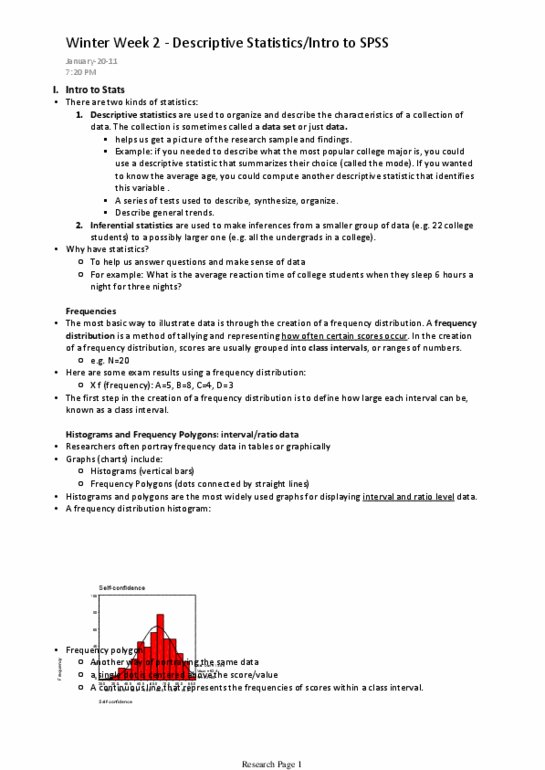
There are two kinds of statistics: descriptive: helps us get a picture of the research sample and findings, inferential: helps us test hypotheses (more later!) To help us answer questions and make sense of data. A series of tests used to: describe, synthesize, organize, discern general trends. Descriptive stats includes: frequency distributions (frequencies, the shape of the distribution of values, measures of variability and central tendency. A count is made of the number of times each value is obtained. The most basic way to illustrate data frequency distribution is a systematic arrangement of numeric values from lowest to highest, together with a count (or percentage) of the number of times each value was obtained. Take a look at the next slide! makes it convenient to see at a glance the highest and lowest scores, the most common scores, and how many patients were in the sample. It"s hard for the teacher to see how well the class did.