QMS 102 Lecture Notes - Design Of Experiments, Standard Deviation

25 Feb 2013
School
Department
Course
Professor
Document Summary
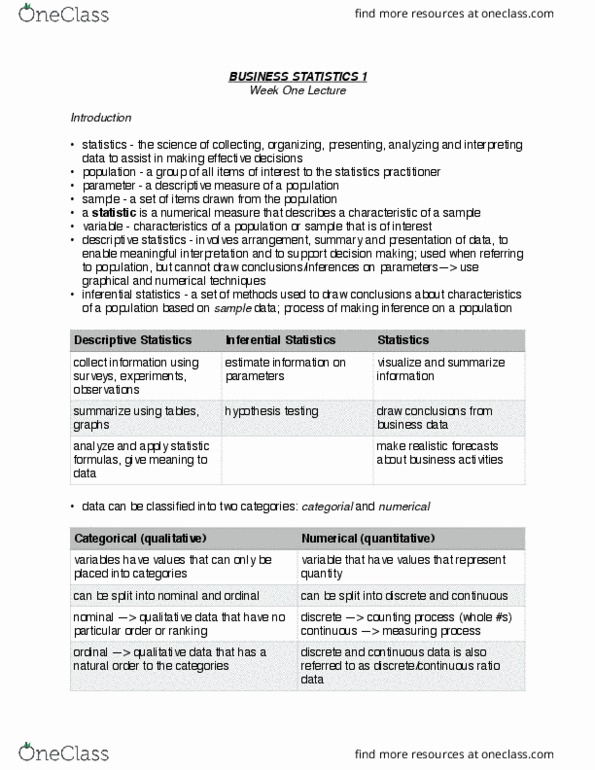
Statistics is the science of collecting, organizing, presenting, analyzing, and interpreting data to assist in making effective decisions. data transforms into information. Present data eg tables and graphs Observed values of variables or responses to a survey. There are two types of data: qualitative (categorized) which can be summarized by graphs or proportions/ratios/percentage and quantitative(numerical) which can be summarized by graphs and/or numerical description(mean, median, mode, standard deviation) Collect data through questionnaire/survey, a designed experiment, and an observed study. Quantitative data discrete (20 years) or continuous(20 years 3months) interval/ratio. Qualitative data nominal has no order or ordinal which has order such as medals in the. Olympics. ( ) 20 30 ( )30 40 range or categorical (qualitative) ( ) 40 50 ( ) above 50. Interval: "0" is only an arbitrary reference point. "0" does not mean nothing *only addition and subtraction. Ratio: "0" does mean the absence of the characteristic being measured, "0" = "nothing"