QMS 102 Lecture Notes - Lecture 6: List Of Bus Routes In Queens, Box Plot, Cheat Sheet

16 Mar 2017
School
Department
Course
Professor

Document Summary
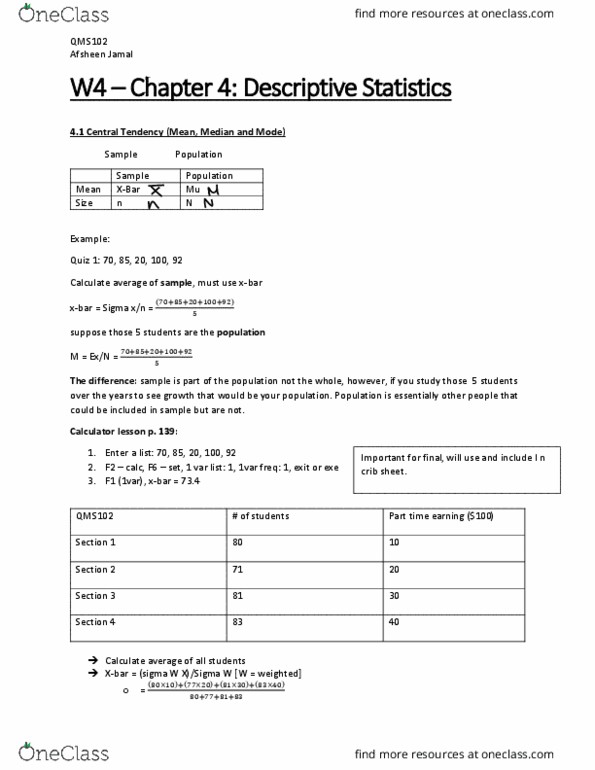
All modules on mystatlab are due by final exam date (best 8 counted) Mean x-bar = [sigma (x)]/n sample. Mode = most frequently occurred number(s) can have 0, 1, 2+ 21 x-bar = sigma w x/ sigma w = (71(35)+20(17)+22(21))/71+20+22. Input list, f2 (calc), 1var xlist: 1 and 1var freq: list 2: what is the average area per person? x-bar = sigma w x/ sigma w = (35(71) + 17(20) + 21(22))/35+17+21. 1var: list 2, and 1var freq: list 1. Chapter 4. 2 variability (sample), how far away the data is from the standard. F2(calc), f6 (set), 1var xlist: list 1, 1var freq: 1, exe(1var) Variance = (standard deviation)^2 , same thing as standard. Whiskers concept: the whiskers cannot go past inner fence, whiskers must end at a data point. Located in between min and q1, as well as max and q3. F2, f6, 1var, exe(1var) x-bar=6 q1=3 qs=9 q2=7 max=12 min=0.