QMS 102 Lecture Notes - Lecture 3: Quartile, Papyrus 75, Cumulative Frequency Analysis

10 Apr 2017
School
Department
Course
Professor
Document Summary
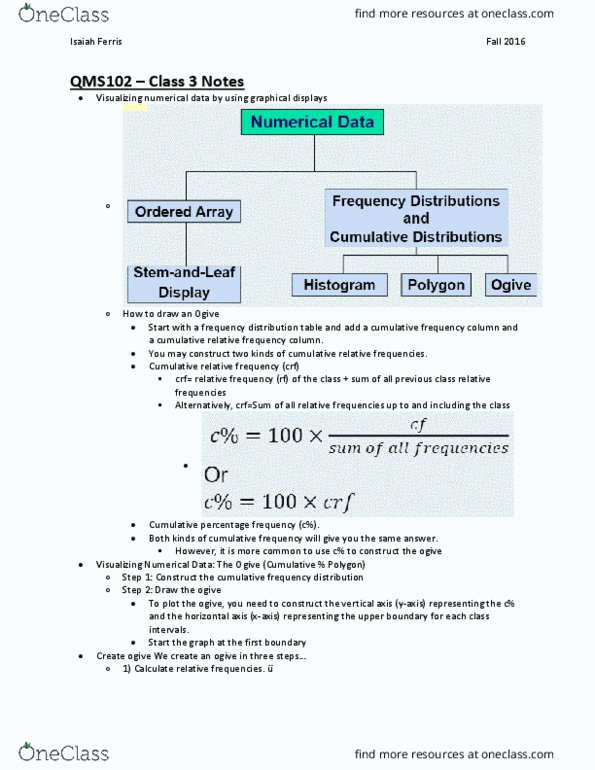
Start with a frequency distribution table and add a cumulative frequency column and a cumulative relative frequency column. Cumulative relation frequency crf (relative frequency of the class + sum of all precious class relative frequencies) Cumulative percentage frequency c% (100 x cf/sum of all frequencies) or (100 x crf) Steps: construct the cumulative frequency distribution, draw the ogive, construct the vertical axis representing c, horizontal representing the upper boundary. A percentile is the value below which a certain percent of observations fall (the 20th percentile is the value below which 20 percent of the observation may be found) The kth percentile in a data set is the value such at most k% of the data is lower than the value at most (100 - k)% of the data is higher than the value. Calculating percentile value: arrange the data into an ascending data array, calculate the rank of the k th percentile using the following formula.