QMS 102 Lecture Notes - Lecture 3: Cumulative Frequency Analysis, Percentile, Royal Institute Of Technology

24 Sep 2015
School
Department
Course
Professor
Document Summary
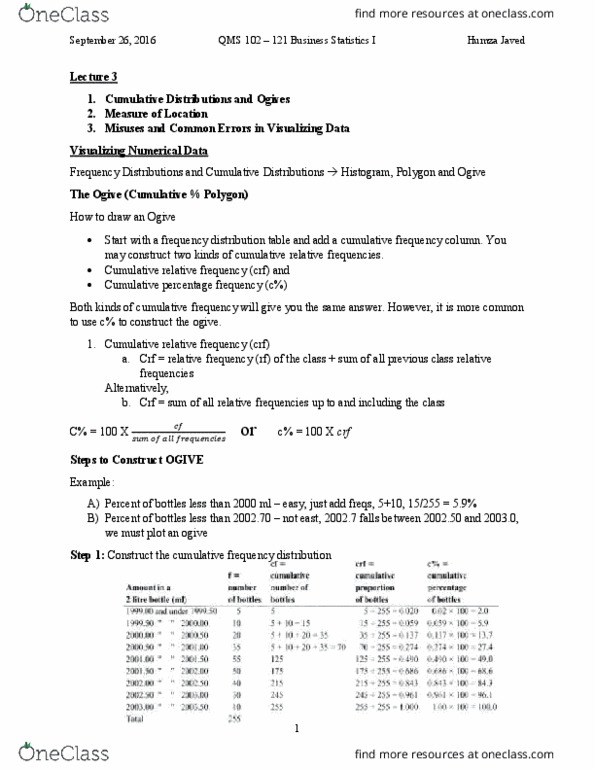
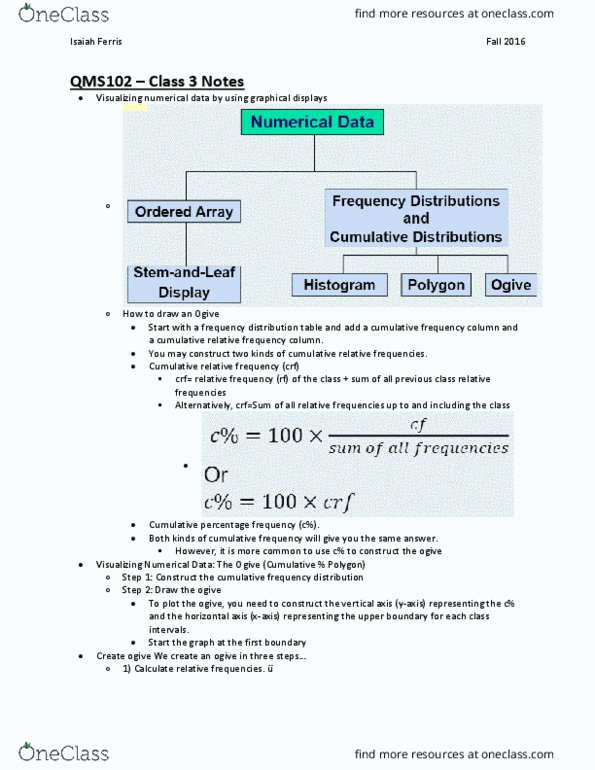
Qms 102 - lecture 3 - visualizing data. Calculate cumulative relative frequencies by adding the current class" relative frequency to the previous class" cumulative relative frequency. Percentiles can be estimated using an ogive. A percentile is a value below which a certain percent of observation fall. The 20th percentile is the value below which 20 percent of the observations. The kth percentile in a data set is the value such that at most k% of the data is lower than the value and at most (100-k)% of the data is higher than the value. There are three steps involved in calculating percentile value. Arrange the data into an ascending data array. Calculate the rank of the k percentile using the following the formula r=rank of pk=half round[n(k 100)+0. 5] Compute where x denotes the observation value corresponding to the rank. First quartile is equivalent to the 25th percentile. Second quartile is equivalent to the 50th percentile.