QMS 102 Lecture Notes - Lecture 12: Control Chart

22 Apr 2016
School
Department
Course
Professor
Document Summary
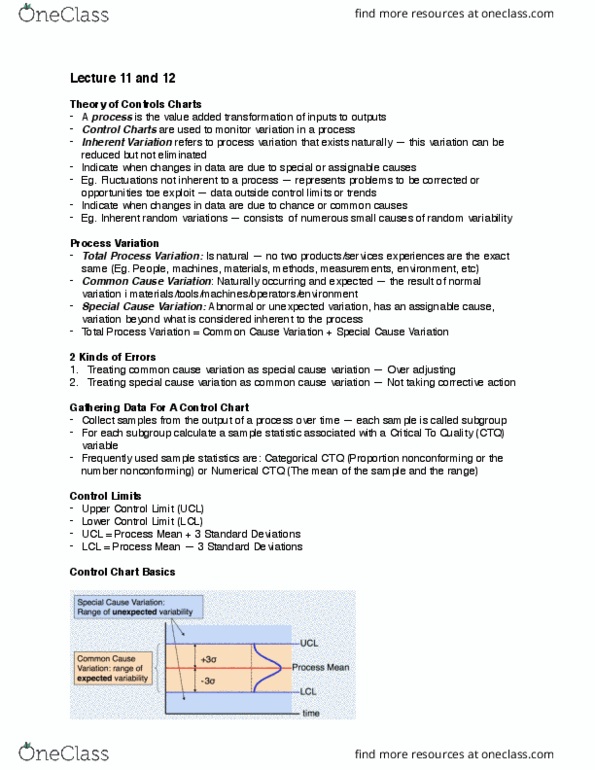
Used to improve quality. (service quality, product quality, etc. ) Process: the value-added transformation of inputs ti outputs. Inherent variation: refers to the process variation that exists naturally. This variation can be reduced but not eliminated. Two causes of variation: special causes of variation. Problems to be corrected or opportunities to exploit. Data outside control limits or trends: common causes of variation. Treating common cause variation as special cause variation results in tampering. Treating special cause as common cause variation results in taking corrective actions when it should not bet taken. Using control charts reduces the chance of committing these errors. In control: if variation is only due to common causes. When the chart does not indicate any out-of-control conditions. Small variations; control chart can be used to monitor the process. If variations are too large; alter the process. Out of control: if the special cause variation exists. Steps should be taken to eliminate the special causes of variation.