QMS 102 Lecture Notes - Lecture 4: Standard Deviation, Box Plot, Weighted Arithmetic Mean

29 Dec 2017
School
Department
Course
Professor
Document Summary
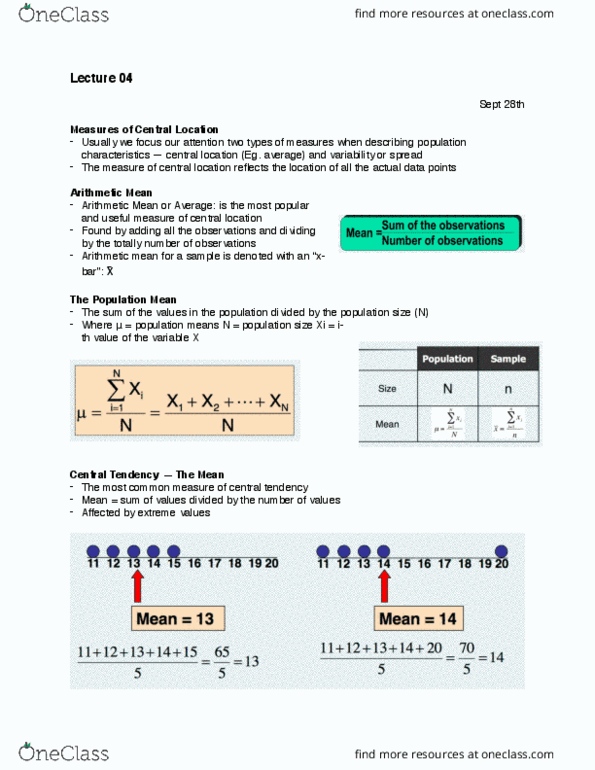
In this lesson, you will learn the measures of central tendency (mean, median, mode) and variability (range, inter quartile range, variance, standard deviation) and to graph a box-whisker plot. We can characterize any data set by measuring its central tendency, variation, and shape. Central tendency values give us a middle or average point of the data. Variability measures the spread or dispersion of the data. We denote sample mean by x , population mean by , sample size by n , and population size by n . Mean is the average value of the data. Sample mean is calculated by the formula x n x. Extreme values in the data distribution do affect the mean. Here, we have to use the weighted average because different stores sold different number of printers. Average price per printer = (cid:2872)(cid:2868) (cid:2874)(cid:2868)(cid:2868)+(cid:2874)(cid:2868) (cid:2873)(cid:2873)(cid:2868)+(cid:2869)(cid:2874)(cid:2868) (cid:2872)(cid:2870)(cid:2873)+(cid:2877)(cid:2868) (cid:2873)(cid:2868)(cid:2868)+(cid:2873)(cid:2868) (cid:2874)(cid:2868)(cid:2868) (cid:2872)(cid:2868)(cid:2868) x.