SOC 481 Lecture Notes - Lecture 11: Contingency Table, Analysis Of Variance, Logistic Regression

Document Summary
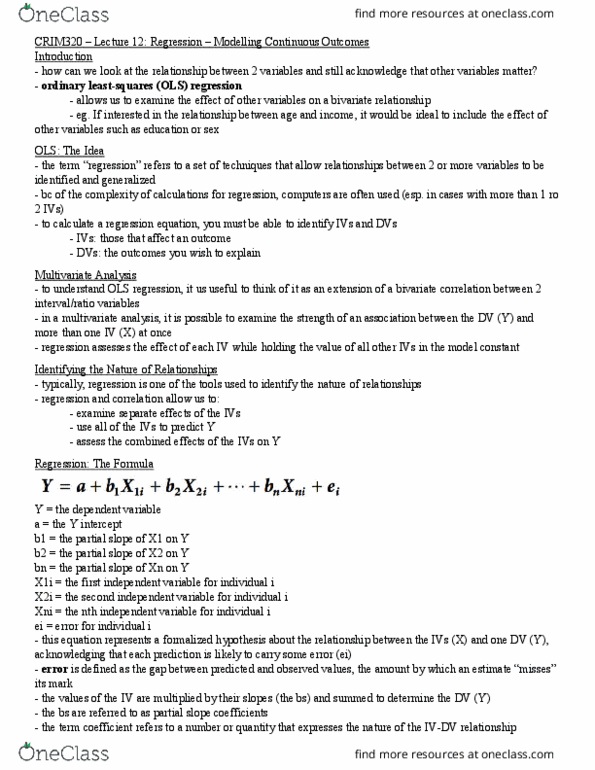
Test de nitions and understanding application questions if you were a researcher in this situation . Final section - what are the strengths and weakness ( for my. 2 ratio level graphing - you must use a scatter plot ( independent x / dependent y) Calculating correlations co ef cients: the covariance is based on how far above or below the variable mean each case is on each variable, this is captured in the sum of product . Pearson"s correlations coef cient the nal numbers tells us weather there are more positive pairs of deviations from the mean or more negative pairs. Regression : a technique used to estimate a mathematical relationship between two or more variables using a set of individual data points. Regression modelling is used to predict the general relationship between a dependent variable and one or more independent variables in the population from which the sample was drawn.