BUEC 232 Lecture 2: W2
BUEC 232 verified notes
2/10View all
Document Summary
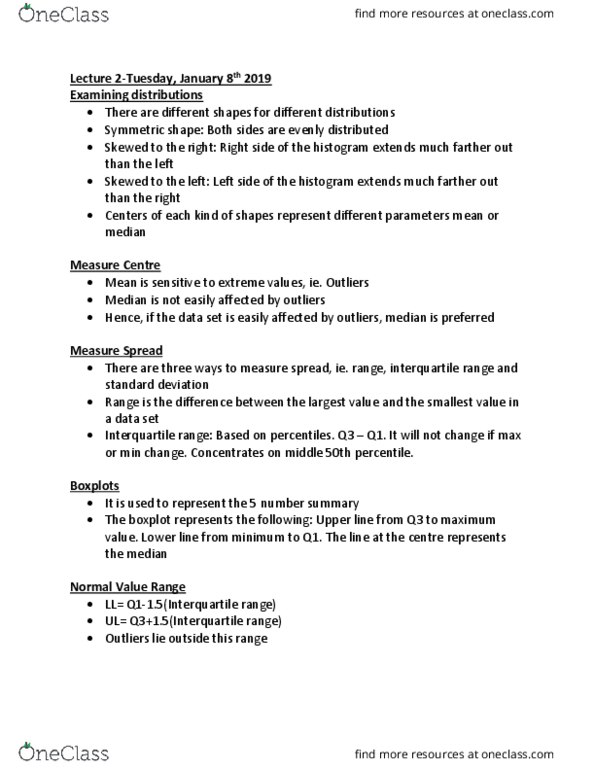
Measure centre: mean is sensitive to extreme values, ie. outliers, median is not easily affected by outliers, hence, if the data set is easily affected by outliers, median is preferred. Measure spread: there are three ways to measure spread, ie. range, interquartile range and standard deviation, range is the difference between the largest value and the smallest value in a data set, interquartile range: based on percentiles. It will not change if max or min change. Boxplots: it is used to represent the 5 number summary, the boxplot represents the following: upper line from q3 to maximum value. The line at the centre represents the median. Normal value range: ll= q1-1. 5(interquartile range, ul= q3+1. 5(interquartile range, outliers lie outside this range. 6 3 = 3 (xi x)^2. 9: x = mean = average = [ ( x1 + x 2 .


