STAT151 Lecture Notes - Lecture 23: Null Hypothesis, West Edmonton Mall, Sample Size Determination

21 Apr 2016
School
Department
Course
Professor


4
STAT151 Full Course Notes
Verified Note
4 documents
Document Summary
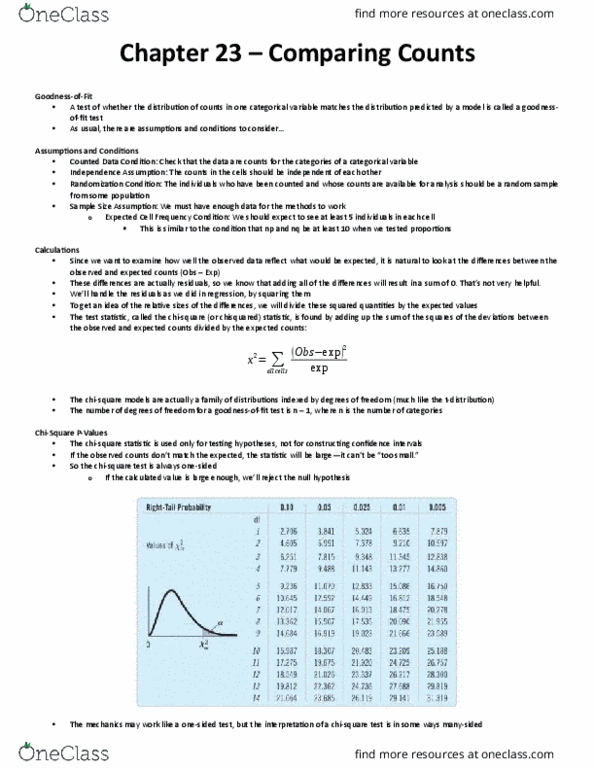
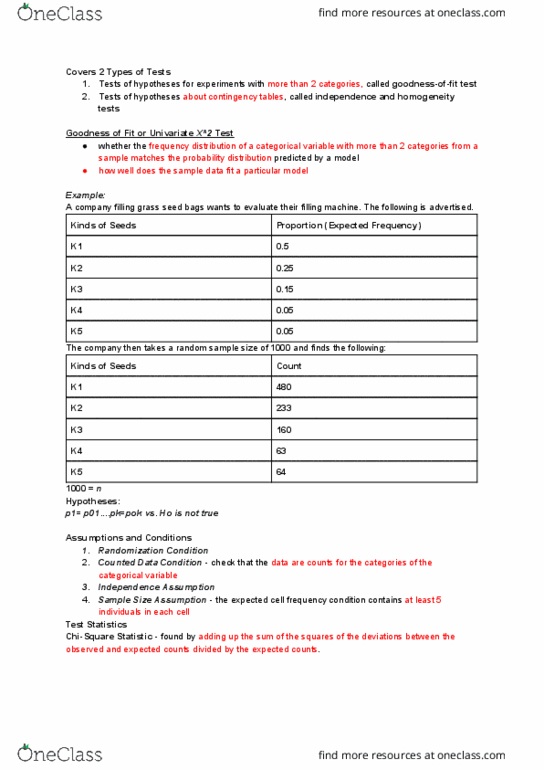
Chi-square tests are used when we want to compare several proportions obtained from one or more categorical variables. For example, we could ask if the birth months of the students in this class distributed as we would expect. There are three chi-square tests, which are in fact hypothesis tests. In all three tests we use frequency tables that provide counts and use the test statistic 2 to help determine whether to reject the null hypothesis. In the goodness of fit chi-square test, we are deciding whether there is enough statistical evidence to conclude that the distribution of data matches a prescribed model. For example, statistics canada provides the following distribution of percentages of birth months: On the first day of class, we took a sample survey in which 139 students responded. It follows that, if our class was indeed a random sample of the population, then we would have the expected number of students born in each month: