GEOG 2110 Lecture Notes - Lecture 5: Ice Age, Loose Coupling

9 Apr 2019
School
Department
Course
Professor
Document Summary
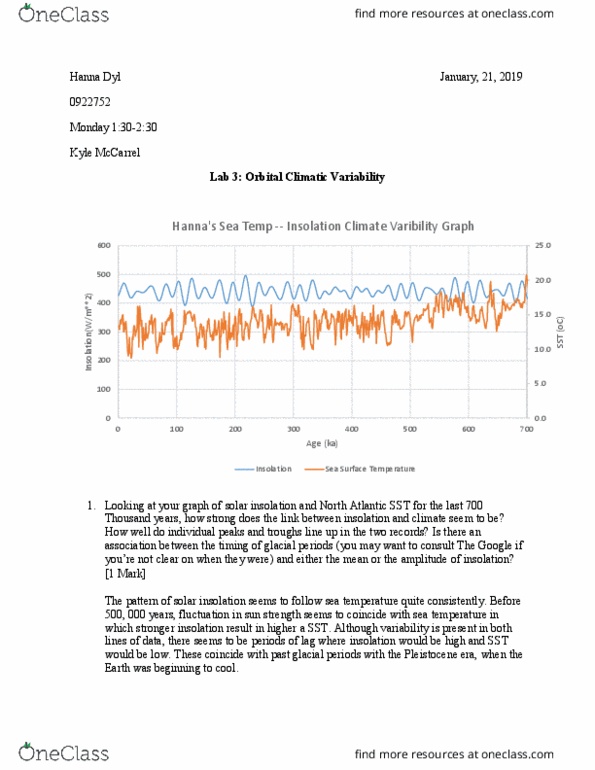
On average, based on the given data, the age difference between the air bubble and the ice in which they are trapped in is approximately 4351. 623 years. To get this value, i subtracted the ice age column by the gas age column. Then, using the sum of the difference between columns, i divided by number of samples being 3311. Prepare a plot showing temperature and co2 over the last 420,000 years. If yes, by approximately how much time? (hint: you may want to examine subsets of the data so that you can see details more clearly. ) The general trend between these two variable is that as temperature deceased co2 concentration decreases as well. The same goes for when temperature shows an increase, The timing at when the variables drop and rise is relatively the same, however temperature seems to be much more variable than co2 concentrations. If examined closely, there is a slight lag of about 1000-2000 years behind temperature.