PSYC 2360 Lecture Notes - Lecture 6: Spurious Relationship, Pearson Product-Moment Correlation Coefficient, Regression Analysis

23 Mar 2016
School
Department
Course
Professor
Document Summary
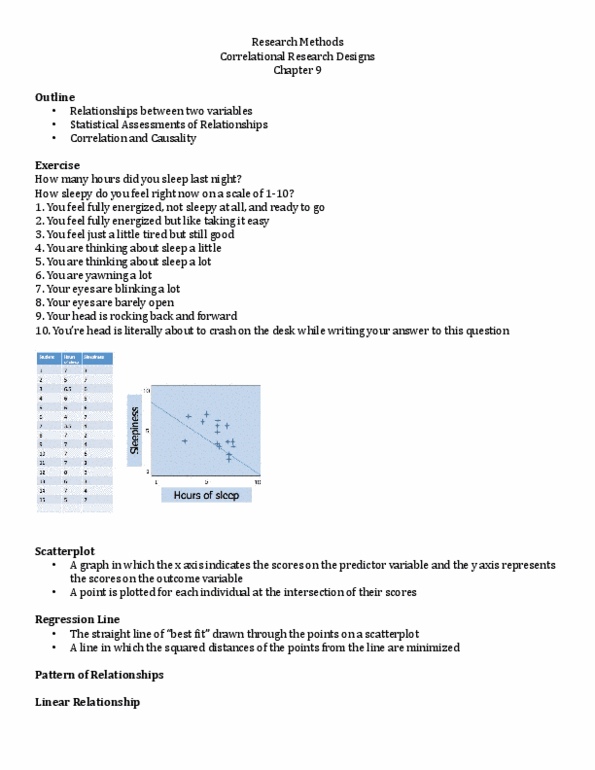
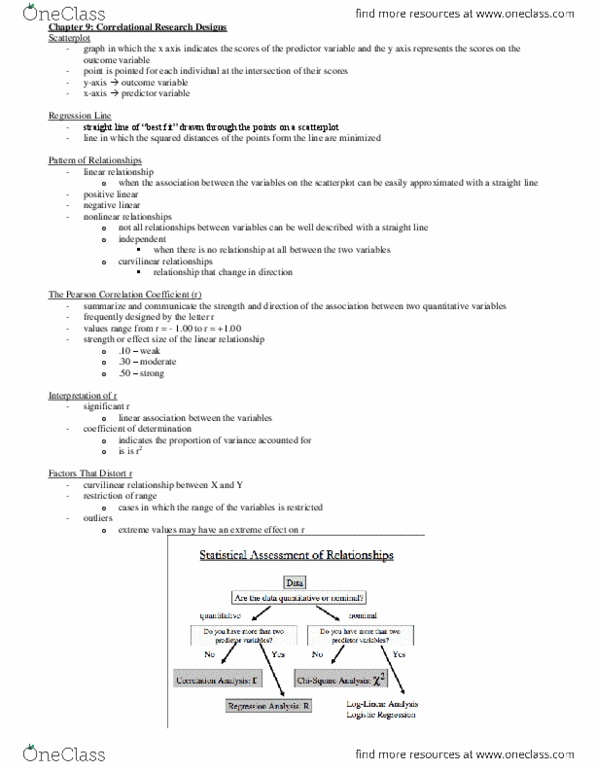
A graph in which the x axis indicates the scores on the predictor variable and the y axis represents the scores on the outcome variable: a point is ploted for each individual at the intersecion of their scores. Regression line: the straight line of best it drawn through the points on a scaterplot, a line in which the squared distances of the points from the line are minimized. Linear relaionship: when the associaion between the variables on the scaterplot can be easily approximated with a straight line. Nonlinear relaionships: not all relaionships between variables can be well described with a straight line. When there is no relaionship at all between the two variables. Used to summarize and communicate the strength and direcion of the associaion between two quanitaive variables. Values range from r = -1. 00 to r = +1. 00. The strength or efect size of the linear relaionship: weak: . 10, moderate: . 30, strong: . 50.