SOAN 2120 Lecture Notes - Lecture 16: Univariate, Analysis Of Variance, Type I And Type Ii Errors

18 Jan 2017
School
Department
Course
Professor
Document Summary
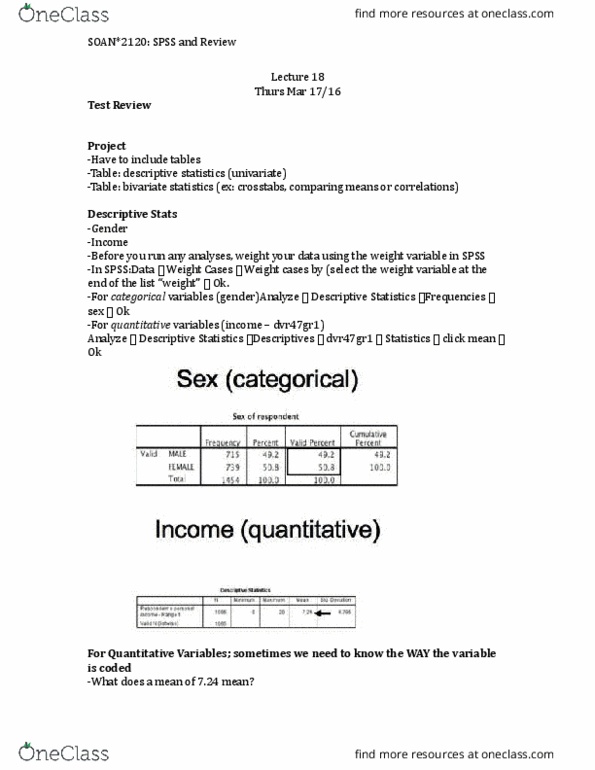
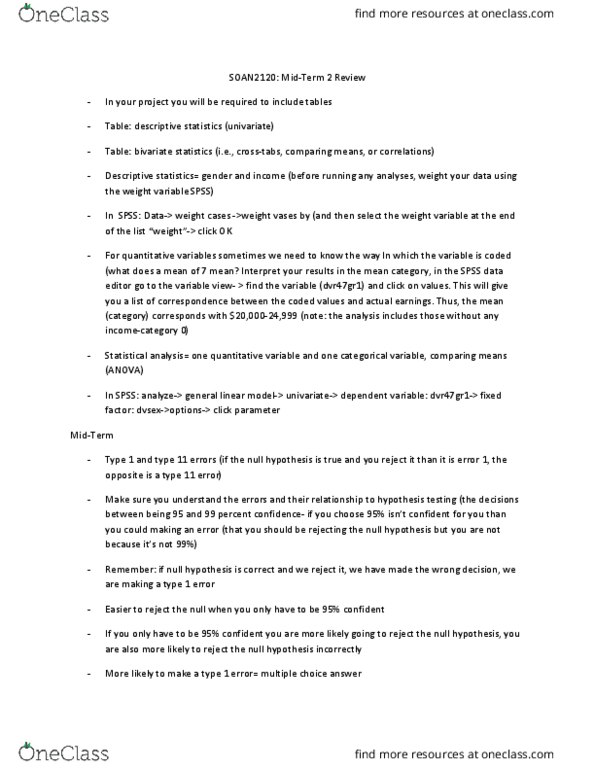
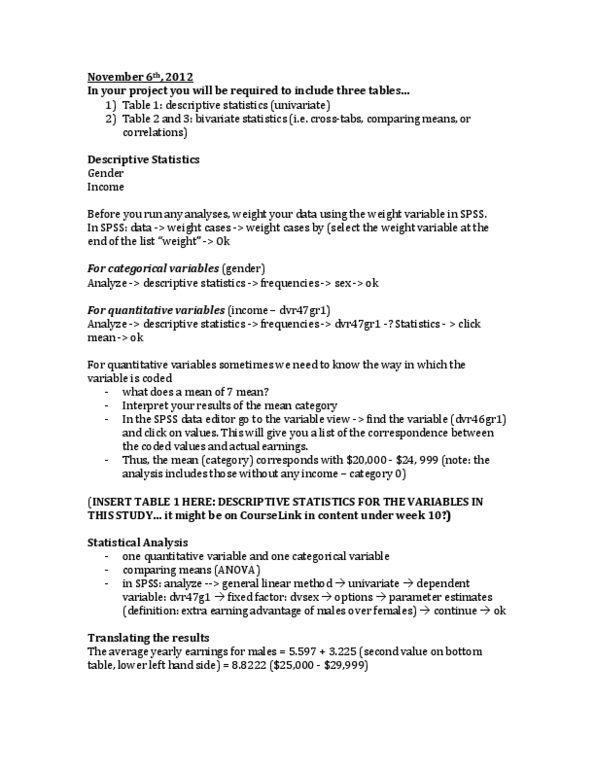
Table: bivariate statistics (ie. , cross-tabs, comparing means, or correlations) Data-> weight cases -> weight cases by (select the weight variable at the end of the list weight -> ok. Analyze-> descriptive statistics-> frequencies -> sex -> ok. For quantitative variables sometimes we need to know the way in which the variable is coded. In the spss data editor go to the variable view. This will give you a list of the correspondence between the coded values and actual earnings. Thus, the mean category corresponds with ,000-,999 (the analysis includes those without any income- category 0) In spss: analyze -> general linear model -> univariate-> dependent. Variable: dvr47gr1-> fixed factor: dvsex-> options -> click parameter estimates-> continue-> ok. The average yearly earnings for females = 5. 597+ 0 =5. 597. Remember: the purpose of the statistical analysis is to identify relationships (whether they are significant) The relationship between _____ and _____is statistically significant.