SOAN 2120 Lecture Notes - Descriptive Statistics, Statistical Significance, Null Hypothesis

3 Mar 2013
School
Department
Course
Professor

Document Summary
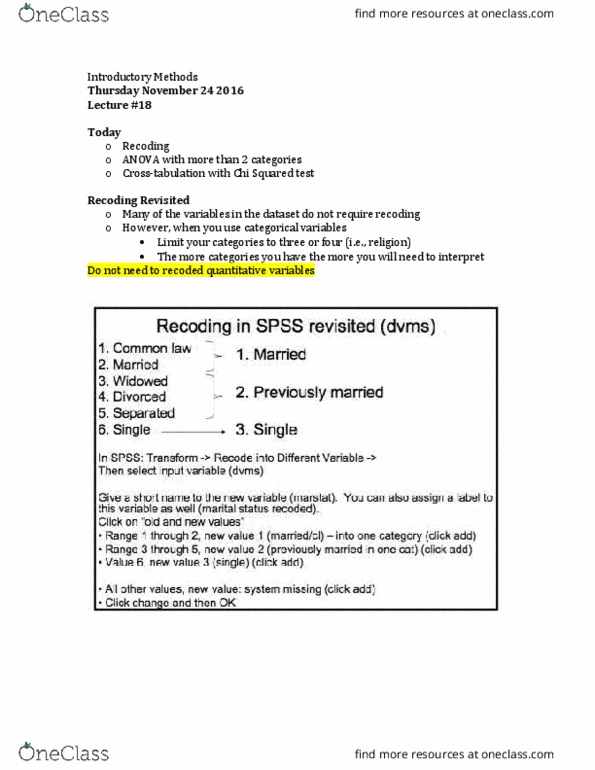
In your project you will be required to include three tables : table 1: descriptive statistics (univariate, table 2 and 3: bivariate statistics (i. e. cross-tabs, comparing means, or correlations) Before you run any analyses, weight your data using the weight variable in spss. In spss: data -> weight cases -> weight cases by (select the weight variable at the end of the list weight -> ok. Analyze -> descriptive statistics -> frequencies -> sex -> ok. For quantitative variables sometimes we need to know the way in which the variable is coded. In the spss data editor go to the variable view -> find the variable (dvr46gr1) and click on values. This will give you a list of the correspondence between the coded values and actual earnings. Thus, the mean (category) corresponds with ,000 - , 999 (note: the analysis includes those without any income category 0) (insert table 1 here: descriptive statistics for the variables in.