PSYC 2260 Lecture Notes - Lecture 12: Regression Analysis, Squared Deviations From The Mean, Coefficient Of Determination

26 Jun 2018
School
Department
Course
Professor

PSYC 2260 Introduction to Research Methods in Psychology Chapter 12
Chapter 12 Prediction
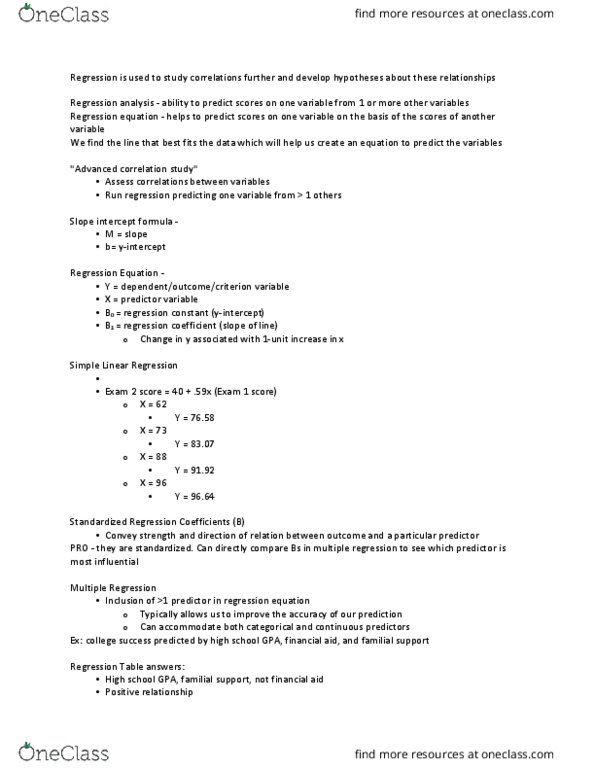
Regression: when correlation is used to predict
- In correlation, order of X and Y doesn’t matter, but in regression, order is important
- X is predictor (independent); Y is criterion (dependent)
Prediction is not causation
- May “causes” between X and Y
Key points: regression allows us to form a prediction, even of we don’t know the causes
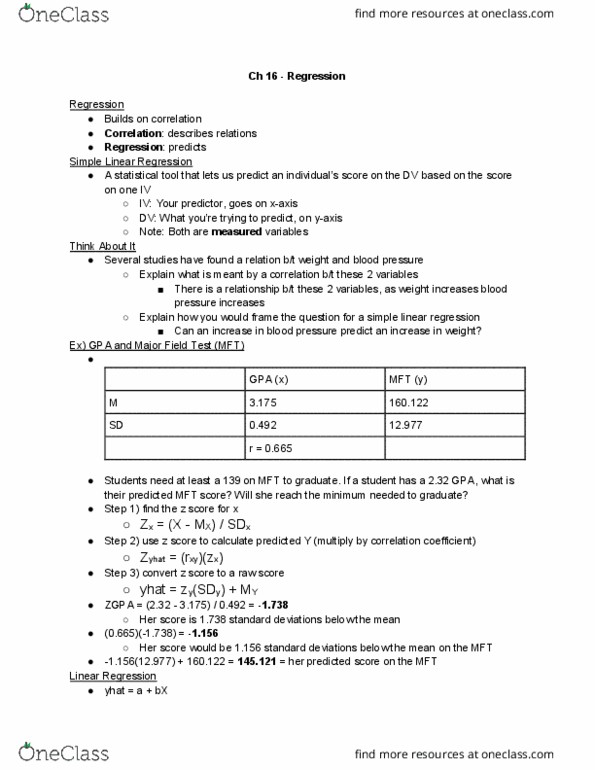
“Linear predictor rule” (formula):
- Ŷ = predicted raw score
- a = regression constant
- b = regression coefficient
- x = raw score on X
Example Ŷ = predicted GPA a = 2.0 b = .3 X = score on motivation test
- Person 1 has X = 5 Ŷ= 2.0 + (3) (5) = 3.5
- Person 2 has X = 1 Ŷ= 2.3
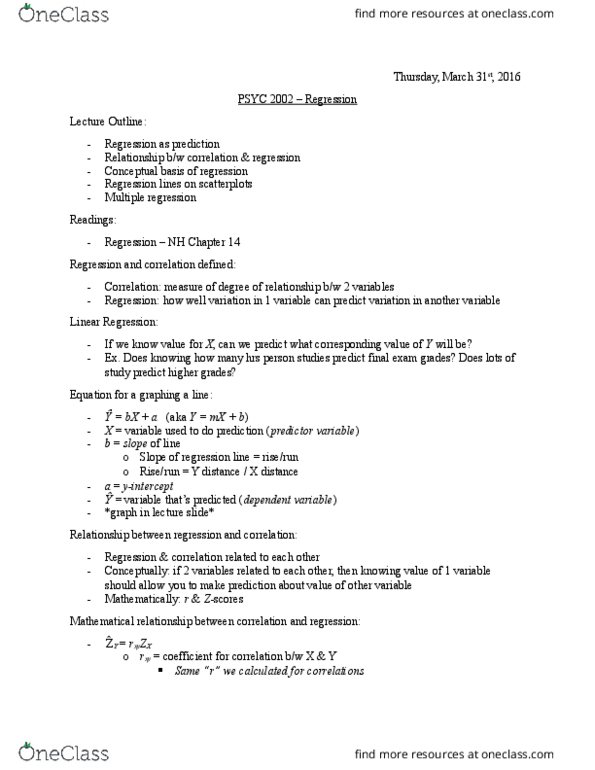
The Regression Line
- Visually, could plot the two predicted scores and draw a line thru them
- Then visually predict GPA for any motivation score
The Slob (B)
- For each unit increase in X, predicted Y increase by amount b
- E.g. if b= .3, of X goes up by 1, Y hoe s up by 3
The intercept of Y (A)
- Intercept (a): the baseline point at which the line intercepts the Y axis
find more resources at oneclass.com
find more resources at oneclass.com
Document Summary
In correlation, order of x and y doesn"t matter, but in regression, order is important. X is predictor (independent); y is criterion (dependent) Key points: regression allows us to form a prediction, even of we don"t know the causes. = predicted raw score a = regression constant. = regression coefficient x = raw score on x. Example = predicted gpa a = 2. 0 b = . 3 x = score on motivation test. Person 1 has x = 5 = 2. 0 + (3) (5) = 3. 5. Person 2 has x = 1 = 2. 3. Visually, could plot the two predicted scores and draw a line thru them. Then visually predict gpa for any motivation score. For each unit increase in x, predicted y increase by amount b. E. g. if b= . 3, of x goes up by 1, y hoe s up by 3. Intercept (a): the baseline point at which the line intercepts the y axis.