GEOG 130 Lecture Notes - Lecture 9: Total Fertility Rate, Infant Mortality, Demographic Transition


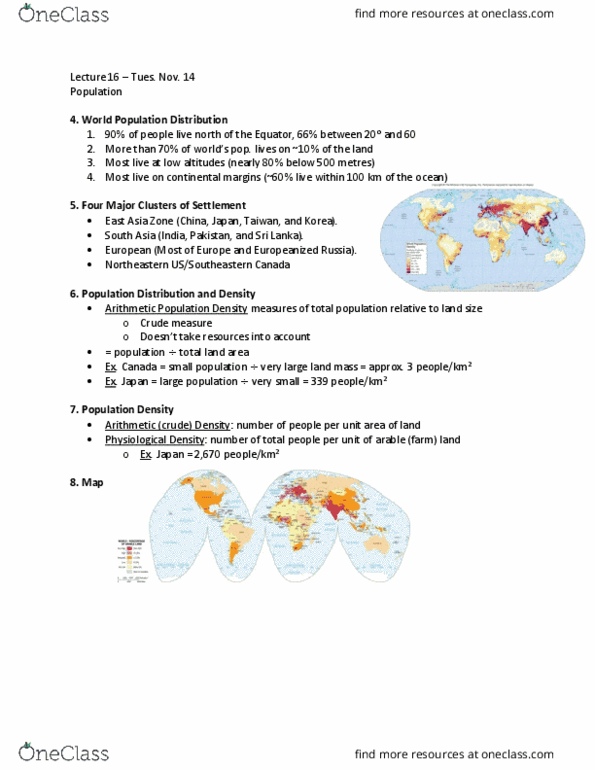
Population density
Arithmetic (crude): number of people per unit area of land
o
Physiological: number of total people per unit of arable (cultivatable) land
o
Agricultural: number of rural people per unit of arable land
o
Population are falling in some parts of the world – if you were updating the map
in 50 years, where would the largest population clusters in the world be?
May move inward because of climate change
o
Resources of land may lead into migration
o
Grow in Africa, South America; lower populations eastern Europe, Japan
o
Africa, North America (modest increase) incline population, decline in population
Asia, Europe, Latin America and Caribbean (including Mexica)
o
Why do populations rise or fall in particular places?
Demographic trends
problem: the planets (in)ability to support so many people
there is a vast gulf in birth and death rates
§
not a simple divide between “have and “have-not” nations
§
o
problem: disparities in living standards, health and economic prospects
Europe and the west face a declining population and a possible “birth
dearth”
§
Continuing population growth in developing countries
§
o
Which demographic trend is predominant for the world?
Reality: both trends are occurring
o
Too many in some, too little in other
o
Two Perspectives
Most new people are added in developing countries (positive growth)
1)
Developed countries are growing slowly or not at all (zero or negative population
growth)
As a result, such demographic disparities result in other processes, primarily
international migration
2)
End result: a new world order
“West” and “North” stagnant in population size
o
“East” and “South” growing rapidly
o
“…the demographic relativities of the future will differ from todays in the certain
diminution [lessening] of the west – and, more generally, the north – giving still
greater cause for a new international order.” – Geoffrey McNicoll (1999)
may change in who’s got the power?
o
Carrying capacity: number of people an area can support on a sustained basis
using a given technology (basis for determining “overcrowding”)
Population bomb?
Thomas Malthus (ca1798) hypothesis: population growth will always create stress
on the means of subsistence
Population growth (exponential 1,2,4,8…) has the potential to outstrip
increase in subsistence resources (linear, 1,2,3,4…)
§
o
Esther Boserup (1965) increasing intensity of agriculture can accommodate
population increases
o
Paul Ehrlich (1960s) warned of a “population bomb” b/c the worlds populations
was outpacing food production
o
1970s onward: some starvation in vulnerable areas (especially in Africa) and
political instability (Ehrlich and Malthus)
o
not wide spreads starvation and deaths (i.e., not 100s of millions Ehrlich and
Malthus)
o
1970s+ the green revolutions intervene:
o
Boserup’s predictions proved right (for now? Climate change and emerging
threat)
S-Shaped curve model
produced under carefully controlled experimental conditions
o
growth process begins slowly, then increases rapidly and finally levels out at a
ceiling
o
still possible that the history of a human population growth will reflect and S-
shaped curve by 2200
o
World population growth – rate of natural increase (doesn’t take into acct.
immigration and emigration)
Population growth in India – significant demographic variations occur with
countries
in India, growth rates are higher in the East and North
o
growth rates vary in India b/c…
1960s population planning program
§
1970s country began forced sterilization program for men w/ 3 or more
children – 22.5 million men were sterilized
§
2004 state of Uttar Pradesh began guns for sterilization program
§
Today, most states use advertising and persuasion to lower birth rates
§
o
World (crude) birth rate – number of births in a year per 1,000 people
Africa leads the way
o
World (crude) death rate – number of deaths in a year per 1,000 people
Russian has a high death rate
o
Demographic transitions – found in Great Britain
Based on change in birth rates, death rates, and natural growth rates over the
course of British industrialization
o
Found a transition occurred when death rates decline and then birth rates
decline, resulting in a low sustained growth rate
o
A model: an idealized or generalized picture of population change occurring over
time
o
“As countries develop, their population characteristics undergo fundamental
changes. They go through a period of transition when their birth rates are high
and their growth rates are excessive. As development takes place, the birth rates
decline and growth rates moderate.”
o
A model describing population change over time
Birth rates
§
Death rates
§
Population change
§
4 stages (or 5)
§
o
developed out of observations of demographic changes in the industrialized
countries over 200 yrs.
o
The 4-5 stages of demographic transition:
Low population growth1)
High growth 2)
Moderate growth 3)
Low growth or stationary4)
Negative population growth? –5th stage crude death rate exceeds
crude birth rate
5)
o
Measure components of population geography:
Major components of population geography
Births/fertility
o
Deaths/mortality
o
Migration
o
Marriage (not going to deal w/ at all)
o
Rate: “the frequency of an events occurrence during a specified period of time.”
Cohort: “a population group unified by a common characteristic.”
Some population definitions
Birth rates – crude birth rate
CBR=(births in a year/population at mid-year)1000
§
A simple/crude measure of fertility in a population
§
Crude b/c the denominator is not limited to women
§
Positive and negative CBR
Requires few data which are commonly available and is easy to
calculate
•
Easy to understand
•
Can subtract crude death rate from CBR to get the crude rate of
natural increase
•
Problem: can mask important age or sex differentials – expected range
in values is 10~50 per 1000. High: >30
•
Canada has low crude birth rates
•
Highest crude birth rates Africa
•
§
o
Death rates – crude death rate, infant mortality rate
CDR=(death in a year/population at mid-year)1000
§
Defined as the number of deaths divided by the population at risk
§
A poor measure of mortality in some respects (not sensitive to age
structure, gender, education, etc.)
§
Mexico has a lower crude death rate than Canada
§
Russia high crude death rates (very problematic)
§
Africa also has high crude death rates (having high crude death rates = bad
conditions)
§
o
Rate of natural increase
Rate of natural increase (RNI) – annual growth rate for a country or region as
a percentage increase
§
RNI=CBR-CDR
§
Saskatchewan population:
2011 SK population: 1033381
•
live births: 14577
•
deaths: 9274
•
CBR: 14.1/1000
•
CDR: 8.9/1000
•
RNI: 14.1-8.9 = 5.2/1000 = 0.52% (per year) – the 0.52% doesn’t
include migration
•
§
Rate of growth – adding migration
A measure of the average, annual rate of increase for a population
•
For the world as a whole, it is possible to convert the RNI to the rate of
population growth by converting the rate per 1000 to an annual
percentage
•
World RNI is 11 per thousand = rate of population growth, 1.1%
•
Most of the time migration must be considered, making RNI different
from rate of growth
•
Canada statistics:
Population: 33,098932
□
Crude birth rate: 10.78/1000
□
CDR: 7.8/1000
□
RNI = 0.3% (no migration)
□
Net migration rate 5.85/1000 population (~0.58%)
□
Population growth rate: 0.88%
□
US RNI: 0.52%
□
US growth rate: 0.9%
□
•
§
Doubling time
The number of years required for a population to double in size
•
Can approximate this by dividing into 70 the annual rate of population
growth
•
Doubling time = 70/annual rate of population growth
•
World/ 70/1.1 = 63 years – the time required to double the present
population would be 64 years, if the population continues to grow at
the same rate
•
§
o
Fertility rates – total fertility rate, replacement level fertility
Notes on fertility – Oct. 13 lecture
§
o
Tuesday, October 11, 2016
Population Geography (week 5 & 6/ pages 10-44)

Population density
Arithmetic (crude): number of people per unit area of land
o
Physiological: number of total people per unit of arable (cultivatable) land
o
Agricultural: number of rural people per unit of arable land
o
Population are falling in some parts of the world – if you were updating the map
in 50 years, where would the largest population clusters in the world be?
May move inward because of climate change
o
Resources of land may lead into migration
o
Grow in Africa, South America; lower populations eastern Europe, Japan
o
Africa, North America (modest increase) incline population, decline in population
Asia, Europe, Latin America and Caribbean (including Mexica)
o
Why do populations rise or fall in particular places?
Demographic trends
problem: the planets (in)ability to support so many people
there is a vast gulf in birth and death rates
§
not a simple divide between “have and “have-not” nations
§
o
problem: disparities in living standards, health and economic prospects
Europe and the west face a declining population and a possible “birth
dearth”
§
Continuing population growth in developing countries
§
o
Which demographic trend is predominant for the world?
Reality: both trends are occurring
o
Too many in some, too little in other
o
Two Perspectives
Most new people are added in developing countries (positive growth) 1)
Developed countries are growing slowly or not at all (zero or negative population
growth)
As a result, such demographic disparities result in other processes, primarily
international migration
2)
End result: a new world order
“West” and “North” stagnant in population size
o
“East” and “South” growing rapidly
o
“…the demographic relativities of the future will differ from todays in the certain
diminution [lessening] of the west – and, more generally, the north – giving still
greater cause for a new international order.” – Geoffrey McNicoll (1999)
may change in who’s got the power?
o
Carrying capacity: number of people an area can support on a sustained basis
using a given technology (basis for determining “overcrowding”)
Population bomb?
Thomas Malthus (ca1798) hypothesis: population growth will always create stress
on the means of subsistence
Population growth (exponential 1,2,4,8…) has the potential to outstrip
increase in subsistence resources (linear, 1,2,3,4…)
§
o
Esther Boserup (1965) increasing intensity of agriculture can accommodate
population increases
o
Paul Ehrlich (1960s) warned of a “population bomb” b/c the worlds populations
was outpacing food production
o
1970s onward: some starvation in vulnerable areas (especially in Africa) and
political instability (Ehrlich and Malthus)
o
not wide spreads starvation and deaths (i.e., not 100s of millions Ehrlich and
Malthus)
o
1970s+ the green revolutions intervene:
o
Boserup’s predictions proved right (for now? Climate change and emerging
threat)
S-Shaped curve model
produced under carefully controlled experimental conditions
o
growth process begins slowly, then increases rapidly and finally levels out at a
ceiling
o
still possible that the history of a human population growth will reflect and S-
shaped curve by 2200
o
World population growth – rate of natural increase (doesn’t take into acct.
immigration and emigration)
Population growth in India – significant demographic variations occur with
countries
in India, growth rates are higher in the East and North
o
growth rates vary in India b/c…
1960s population planning program
§
1970s country began forced sterilization program for men w/ 3 or more
children – 22.5 million men were sterilized
§
2004 state of Uttar Pradesh began guns for sterilization program
§
Today, most states use advertising and persuasion to lower birth rates
§
o
World (crude) birth rate – number of births in a year per 1,000 people
Africa leads the way
o
World (crude) death rate – number of deaths in a year per 1,000 people
Russian has a high death rate
o
Demographic transitions – found in Great Britain
Based on change in birth rates, death rates, and natural growth rates over the
course of British industrialization
o
Found a transition occurred when death rates decline and then birth rates
decline, resulting in a low sustained growth rate
o
A model: an idealized or generalized picture of population change occurring over
time
o
“As countries develop, their population characteristics undergo fundamental
changes. They go through a period of transition when their birth rates are high
and their growth rates are excessive. As development takes place, the birth rates
decline and growth rates moderate.”
o
A model describing population change over time
Birth rates
§
Death rates
§
Population change
§
4 stages (or 5)
§
o
developed out of observations of demographic changes in the industrialized
countries over 200 yrs.
o
The 4-5 stages of demographic transition:
Low population growth1)
High growth 2)
Moderate growth 3)
Low growth or stationary4)
Negative population growth? –5th stage crude death rate exceeds
crude birth rate
5)
o
Measure components of population geography:
Major components of population geography
Births/fertility
o
Deaths/mortality
o
Migration
o
Marriage (not going to deal w/ at all)
o
Rate: “the frequency of an events occurrence during a specified period of time.”
Cohort: “a population group unified by a common characteristic.”
Some population definitions
Birth rates – crude birth rate
CBR=(births in a year/population at mid-year)1000
§
A simple/crude measure of fertility in a population
§
Crude b/c the denominator is not limited to women
§
Positive and negative CBR
Requires few data which are commonly available and is easy to
calculate
•
Easy to understand
•
Can subtract crude death rate from CBR to get the crude rate of
natural increase
•
Problem: can mask important age or sex differentials – expected range
in values is 10~50 per 1000. High: >30
•
Canada has low crude birth rates
•
Highest crude birth rates Africa
•
§
o
Death rates – crude death rate, infant mortality rate
CDR=(death in a year/population at mid-year)1000
§
Defined as the number of deaths divided by the population at risk
§
A poor measure of mortality in some respects (not sensitive to age
structure, gender, education, etc.)
§
Mexico has a lower crude death rate than Canada
§
Russia high crude death rates (very problematic)
§
Africa also has high crude death rates (having high crude death rates = bad
conditions)
§
o
Rate of natural increase
Rate of natural increase (RNI) – annual growth rate for a country or region as
a percentage increase
§
RNI=CBR-CDR
§
Saskatchewan population:
2011 SK population: 1033381
•
live births: 14577
•
deaths: 9274
•
CBR: 14.1/1000
•
CDR: 8.9/1000
•
RNI: 14.1-8.9 = 5.2/1000 = 0.52% (per year) – the 0.52% doesn’t
include migration
•
§
Rate of growth – adding migration
A measure of the average, annual rate of increase for a population
•
For the world as a whole, it is possible to convert the RNI to the rate of
population growth by converting the rate per 1000 to an annual
percentage
•
World RNI is 11 per thousand = rate of population growth, 1.1%
•
Most of the time migration must be considered, making RNI different
from rate of growth
•
Canada statistics:
Population: 33,098932
□
Crude birth rate: 10.78/1000
□
CDR: 7.8/1000
□
RNI = 0.3% (no migration)
□
Net migration rate 5.85/1000 population (~0.58%)
□
Population growth rate: 0.88%
□
US RNI: 0.52%
□
US growth rate: 0.9%
□
•
§
Doubling time
The number of years required for a population to double in size
•
Can approximate this by dividing into 70 the annual rate of population
growth
•
Doubling time = 70/annual rate of population growth
•
World/ 70/1.1 = 63 years – the time required to double the present
population would be 64 years, if the population continues to grow at
the same rate
•
§
o
Fertility rates – total fertility rate, replacement level fertility
Notes on fertility – Oct. 13 lecture
§
o
Tuesday, October 11, 2016
Population Geography (week 5 & 6/ pages 10-44)
Document Summary
Population geography (week 5 & 6/ pages 10-44) Population density o o o o o o o. Arithmetic (crude): number of people per unit area of land. Physiological: number of total people per unit of arable (cultivatable) land. Agricultural: number of rural people per unit of arable land. Grow in africa, south america; lower populations eastern europe, japan. Africa, north america (modest increase) incline population, decline in population. Asia, europe, latin america and caribbean (including mexica) Europe and the west face a declining population and a possible birth dearth . Most new people are added in developing countries (positive growth) Developed countries are growing slowly or not at all (zero or negative population growth) ap ation. As a result, such demographic disparities result in other processes, primarily international migration. End result: a new world order o o. Carrying capacity: number of people an area can support on a sustained basis using a given technology (basis for determining overcrowding ) o.