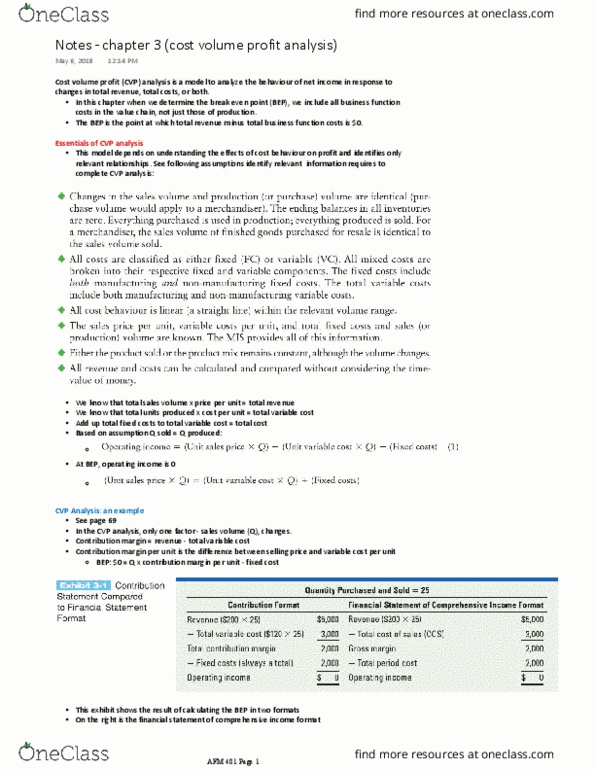
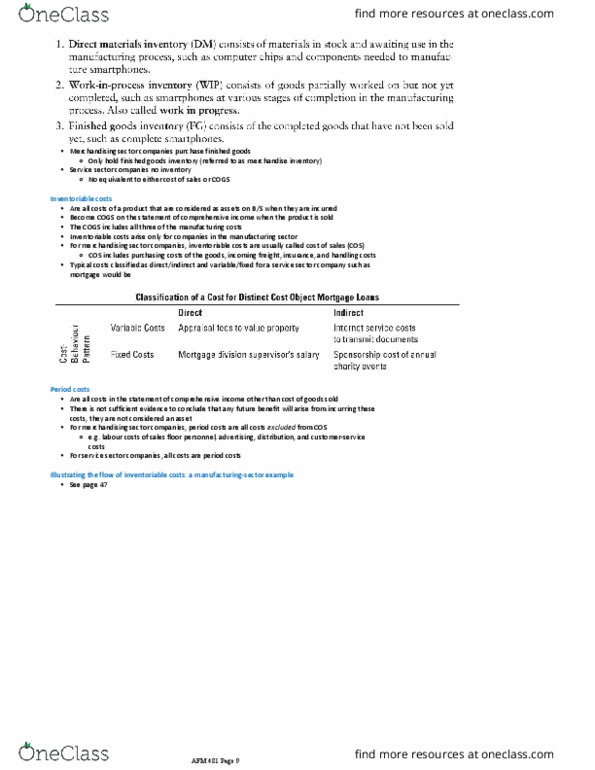
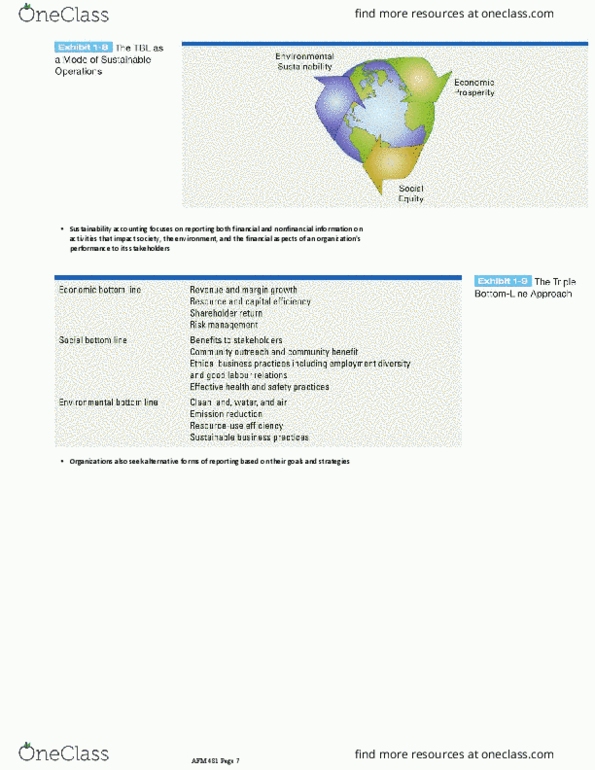
AFM481 Lecture Notes - Lecture 8: Combined Gas And Steam


This preview shows half of the first page of the document.
Unlock all 2 pages and 3 million more documents.
Get access


Related Documents
Related Questions
Analyzing and Interpreting Equity Accounts and Comprehensive Income
Following is the shareholdersâ equity section of the 2013 balance sheet for Procter & Gamble Company and its statement of shareholdersâ equity.
| June 30 (In millions, except per share amounts) | 2013 |
|---|---|
| Shareholders' Equity | |
| Convertible Class A preferred stock, stated value $ 1 per share | |
| (600 shares authorized) | $ 1,137 |
| Non-voting Class B preferred stock, stated value $ 1 per share | |
| (200 shares authorized) | -- |
| Common stock, stated value $ 1 per share | |
| (10,000 shares authorized; shares issued: 2013-4,009.2) | 4,009 |
| Additional paid-in capital | 63,538 |
| Reserve for ESOP debt retirement | (1,352) |
| Accumulated other comprehensive income/(loss) | (7,499) |
| Treasure stock, at cost (shares held: 2013-1,266.9) | (71,966) |
| Retained earnings | 80,197 |
| Noncontrolling interest | 645 |
| Total shareholders' equity | $ 68,709 |
| Consolidated Statement of Shareholders' Equity | ||||||||||
|---|---|---|---|---|---|---|---|---|---|---|
| Dollars in millions; Shares in thousands | Common Shares Outstanding | Common Stock | Preferred Stock | Additional Paid-in Capital | Reserve for ESOP Debt Retirement | Accumulated Other Comprehensive Income (Loss) | Treasury Stock | Retained Earnings | Noncontrolling Interest | Total |
| Balance June 30, 2012 | $ 2,748,033 | $ 4,008 | $ 1,195 | $ 63,181 | $ (1,357) | $ (9,333) | $ (69,604) | $ 75,349 | $ 596 | $ 64,035 |
| Net earnings | 11,312 | 90 | 11,402 | |||||||
| Other comprehensive income | 1,834 | 1,834 | ||||||||
| Dividends to shareholders: | ||||||||||
| Common | (6,275) | (6,275) | ||||||||
| Preferred, net of tax benefits | (244) | (244) | ||||||||
| Treasury purchases | (84,234) | (5,986) | (5,986) | |||||||
| Employee plan issuances | 70,923 | 1 | 352 | 3,573 | 3,926 | |||||
| Preferred stock conversions | 7,605 | (58) | 7 | 51 | â | |||||
| ESOP debt impacts | 5 | 55 | 60 | |||||||
| Noncontrolling interest, net | (2) | (41) | (43) | |||||||
| Balance June 30, 2013 | $ 2,742,327 | $ 4,009 | $ 1,137 | $ 63,538 | $ (1,352) | $ (7,499) | $ (71,966) | $ 80,197 | $ 645 | $ 68,709 |
(a) What does the term convertible (in reference to the company's Class A preferred stock) mean?
Convertible means the holder of the security has an obligation to convert (exchange) the security into another security.
Convertible means the holder of the security has an option to surrender the security and to receive cash at any time.
Convertible means the holder of the security has an option to convert (exchange) the security into another security.
Convertible means the holder of the security has an option to sell the security at any time.
(b) How many shares of common stock did Procter & Gamble issue when convertible Class A preferred stock was converted during fiscal 2013?
Answer
thousand shares
(c) For "employee plan issuances," at what average price was the common stock issued as of year-end 2013? (Round your answer to two decimal places.)
$Answer
(d) What is the accumulated other comprehensive income account?
The accumulated other comprehensive income account reflects the cumulative profit recognized by the company less the cumulative dividends that have been paid to shareholders.
The accumulated other comprehensive income account reflects the cumulative change in net assets (defined as assets less liabilities) for transactions other than net income transactions and transactions with shareholders.
The accumulated other comprehensive income account reflects the cumulative profit on transactions with shareholders.
The accumulated other comprehensive income account reflects the cumulative amount by which the company's common stock has increased or decreased since issuance.
(e) What cash dividends did Procter & Gamble pay in 2013 for each class of stock?
Common dividends =Answer
($ millions)
Preferred dividends =Answer($ millions)

7. Consider theeffects of the independent transactions, a through i, on acompanyâs balance sheet, income statement, statement of cash flows,and statement of stockholdersâ equity.
a. The company purchasedinventory on credit.
b. The company sold allinventory purchased in transaction a) on credit (and formore than its cost).
c. The company collectedcash from customers from transaction b).
d. The company purchasedequipment with cash.
e. The company paid cash fora note payable that came due.
f. The company paidcash for interest on borrowings.
g. Wages were earned bycompany employees but not yet paid.
h. The company paid cash individends.
i. The companyreceived cash for the issuance of stock.
Complete the table below to explainthe effects and financial statement linkages. Use â+â to indicatethe account increases and âââ to indicate the account decreases (15pts).
a. | b. | c. | d. | e. | f. | g. | h. | i. | |||||||||||
Balance sheet | |||||||||||||||||||
Cash | |||||||||||||||||||
Noncash assets | |||||||||||||||||||
Total liabilities | |||||||||||||||||||
Contributed capital | |||||||||||||||||||
Retained earnings | |||||||||||||||||||
Statement of cash flows | |||||||||||||||||||
Operating cash flow | |||||||||||||||||||
Investing cash flow | |||||||||||||||||||
Financing cash flow | |||||||||||||||||||
Income statement | |||||||||||||||||||
Revenues | |||||||||||||||||||
Expenses | |||||||||||||||||||
Net earnings | |||||||||||||||||||
Statement of stockholdersâ equity | |||||||||||||||||||
Contributed capital | |||||||||||||||||||
Retained earnings | |||||||||||||||||||

The income statement for CashCat Company for the year ending December 31, 2016 is shown in Exhibit 1 and balance sheets as of December 31, 2015 and 2016 are shown in Exhibit 2. The companyâs accountant provided the additional information for transactions during 2016:
(1) Purchased property, plant and equipment (PP&E) at a cost of $400,000.
(2) Issued $98,000 of new bonds payable.
(3) Issued common stock for $25,000.
Required: Prepare a statement of cash flows, in good form, for 2016 using the indirect method.
| EXHIBIT 1 | |||||
| CASHCAT COMPANY | |||||
| Income Statements | |||||
| For the Year Ending December 31, 2016 | |||||
| Total revenue | $1,000,000 | ||||
| Costs and expenses: | |||||
| Cost of sales | $425,000 | ||||
| General and administrative expense | 300,000 | ||||
| Depreciation-PP&E | 60,000 | ||||
| Total costs and expenses | 785,000 | ||||
| Operating income | 215,000 | ||||
| Other items: | |||||
| Gain on retirement of bonds | 25,000 | ||||
| Loss on sale of PP&E | (10,000) | ||||
| Interest expense | (80,000) | ||||
| Income before income taxes | 150,000 | ||||
| Income taxes | 50,000 | ||||
| Net income | $100,000 | ||||
| EXHIBIT 2 | |||||||
| CASHCAT COMPANY | |||||||
| Balance Sheets | |||||||
| For the Years Ending December 31, 2015 and 2016 | |||||||
| Current Assets: | 2015 | 2016 | |||||
| Cash and cash equivalents | $20,000 | $16,000 | |||||
| Accounts receivable | 80,000 | 90,000 | |||||
| Inventory | 40,000 | 30,000 | |||||
| Total current assets | $140,000 | $136,000 | |||||
| Property, Plant and Equipment: | |||||||
| Property, plant and equipment at cost | $800,000 | $900,000 | |||||
| Accumulated depreciation | (325,000) | (350,000) | |||||
| Net property and equipment | 475,000 | 550,000 | |||||
| Total assets | $615,000 | $686,000 | |||||
| Current Liabilities: | |||||||
| Accounts payable | $85,000 | $100,000 | |||||
| Income taxes payable | 30,000 | 28,000 | |||||
| Total current liabilities | $115,000 | $128,000 | |||||
| Long-Term Debt | |||||||
| Bonds payable | $270,000 | $268,000 | |||||
| Stockholders' Equity: | |||||||
| Common stock | $10,000 | $15,000 | |||||
| Capital in excess of par value | 80,000 | 85,000 | |||||
| Retained earnings | 180,000 | 210,000 | |||||
| Treasury stock | (40,000) | (20,000) | |||||
| Total stockholder's Equity | 230,000 | 290,000 | |||||
| Total liabilities and stockholders' equity | $615,000 | $686,000 | |||||
| check | 0 | 0 | |||||
