AFM481 Lecture Notes - Lecture 11: Contribution Margin, Fixed Cost, Variable Cost

28 Jun 2018
School
Department
Course
Professor

In this chapter when we determine the break even point (BEP), we include all business function
costs in the value chain, not just those of production.
•
The
BEP
is the point at which total revenue minus total business function costs is $0.
•
Cost volume profit (CVP) analysis
is a model to analyze the behaviour of net income in response to
changes in total revenue, total costs, or both.
This model depends on understanding the effects of cost behaviour on profit and identifies only
relevant relationships. See following assumptions identify relevant information requires to
complete CVP analysis:
•
Essentials of CVP analysis
We know that total sales volume x price per unit = total revenue•
We know that total units produced x cost per unit = total variable cost
•
Add up total fixed costs to total variable cost = total cost
•
○
Based on assumption Q sold = Q produced:
•
○
At BEP, operating income is 0
•
See page 69
•
In the CVP analysis, only one factor
-
sales volume (Q), changes.
•
Contribution margin =
revenue
-
total variable cost
•
BEP: $0 = Q x contribution margin per unit
-
fixed cost
○
Contribution margin per unit
is the difference between selling price and variable cost per unit
•
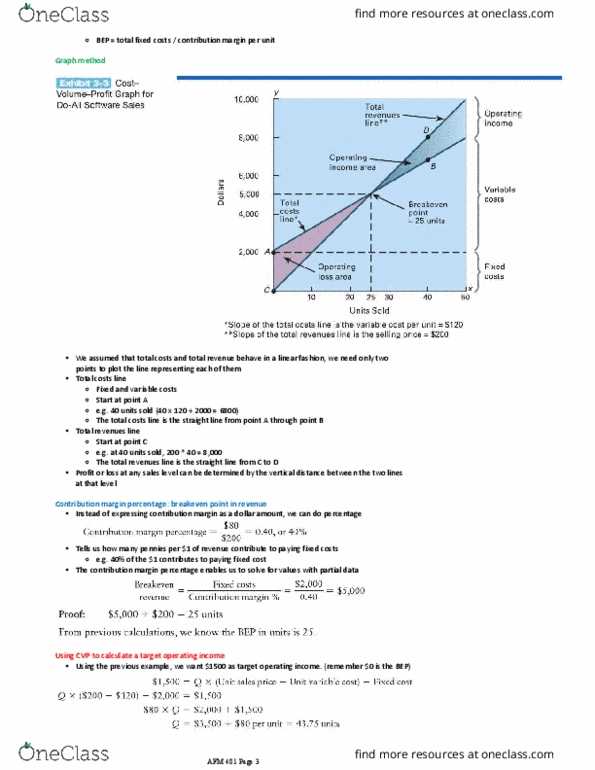
CVP Analysis: an example
This exhibit shows the result of calculating the BEP in two formats•
On the right is the financial statement of comprehensive income format
•
On the left is a
contribution statement of comprehensive income
, which groups costs as either
•
Notes
-
chapter 3 (cost volume profit analysis)
May 6, 2018 12:14 PM
AFM 481 Page 1
Document Summary
Notes - chapter 3 (cost volume profit analysis) Cost volume profit (cvp) analysis is a model to analyze the behaviour of net income in response to changes in total revenue, total costs, or both. In this chapter when we determine the break even point (bep), we include all business function costs in the value chain, not just those of production. The bep is the point at which total revenue minus total business function costs is sh. This model depends on understanding the effects of cost behaviour on profit and identifies only relevant relationships. See following assumptions identify relevant information requires to complete cvp analysis: We know that total sales volume x price per unit = total revenue. We know that total units produced x cost per unit = total variable cost. Add up total fixed costs to total variable cost = total cost. Based on assumption q sold = q produced: