ENVS178 Lecture 4: LEcture 5&6

4 Apr 2016
School
Department
Course
Professor
Document Summary
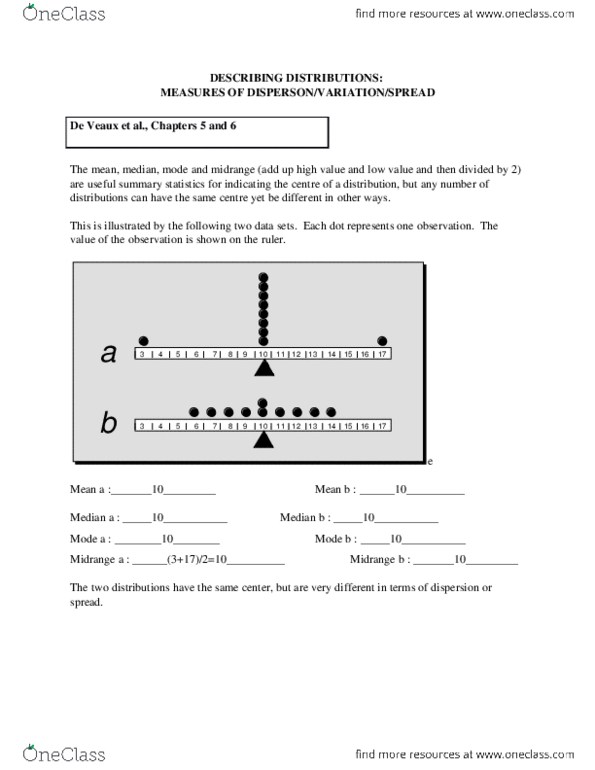
De veaux et al. , chapters 5 and 6. Story: jb, fox tv, nfl commentator, superbowl 2003, sitting on ice, hair on ire, on average you"re okay. The mean, median, mode and midrange are useful summary statistics for indicating the centre of a distribution, but any number of distributions can have the same centre yet be different in other ways. This is illustrated by the following two data sets. The value of the observation is shown on the ruler. a. The two distributions have the same center, but are very different in terms of dispersion or spread. For example, the range for the two examples above are calculated as follows: It tends to be used either (a) in conjunction with other measures of dispersion (irst thing reported), or (b) in situations where there is a clear trend and a lot of noise or many small fluctuations. An example of the latter is shown at right.