GEOG281 Lecture Notes - Lecture 10: Spatial Analysis, Autocorrelation

5 Apr 2016
School
Department
Course
Professor
Document Summary
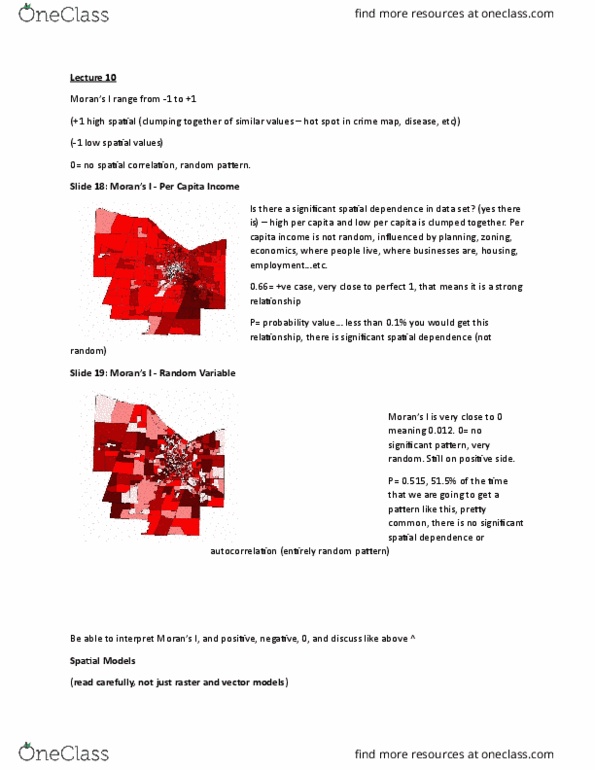
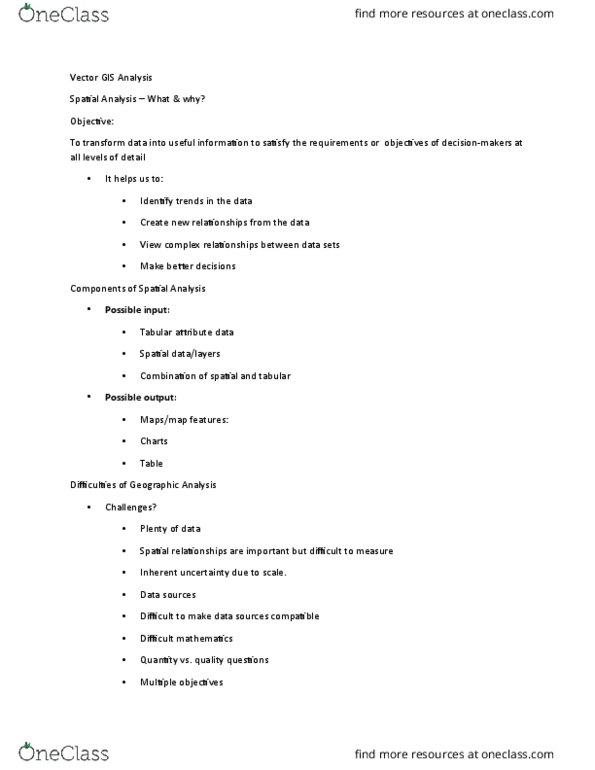
Spaial models (read carefully, not just raster and vector models) Spaial data analysis uses spaial and non-spaial atributes in the database to answer quesions about the real world. It transforms data into useful informaion to saisfy the requirements or objecives of decision-makers at all levels of detail. We can measure spaial dependency by using spaial autocorrelaion and the moran"s i indices. It measures correlated proximal locaions either posiively or negaively by comparing values of a sample with values of their neighbours. If there is any spaial distribuion of a variable, it is said to be spaially autocorrelated. Moran"s i is when an index of spaial autocorrelaion is given. If the moran"s i is 0. 66 this means that it is posiive and very close to 1, indicaing a strong relaionship and there is signiicant spaial dependence. The probability is less than 0. 001 meaning that there is less than 1% chance this relaionship would occur.