COMM 291 Lecture Notes - Lecture 4: Categorical Variable, Skewness, Unimodality

COMM 291 verified notes
4/11View all
Document Summary
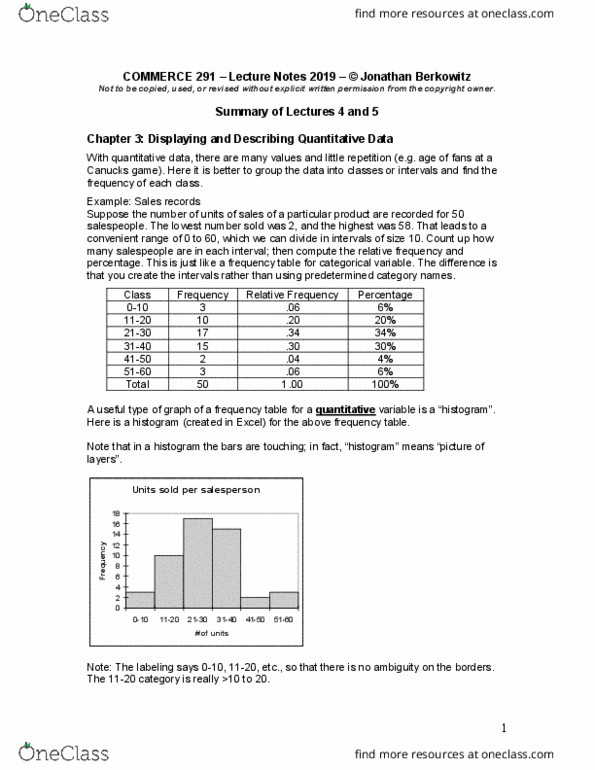
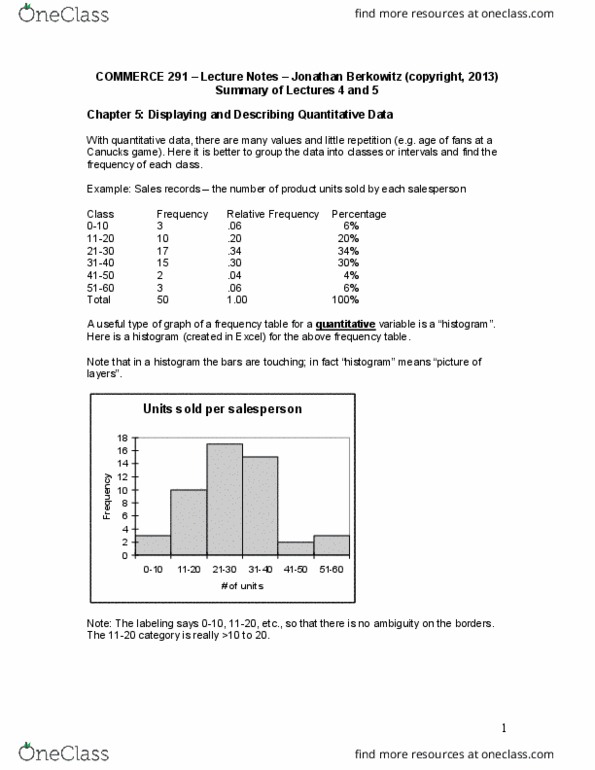
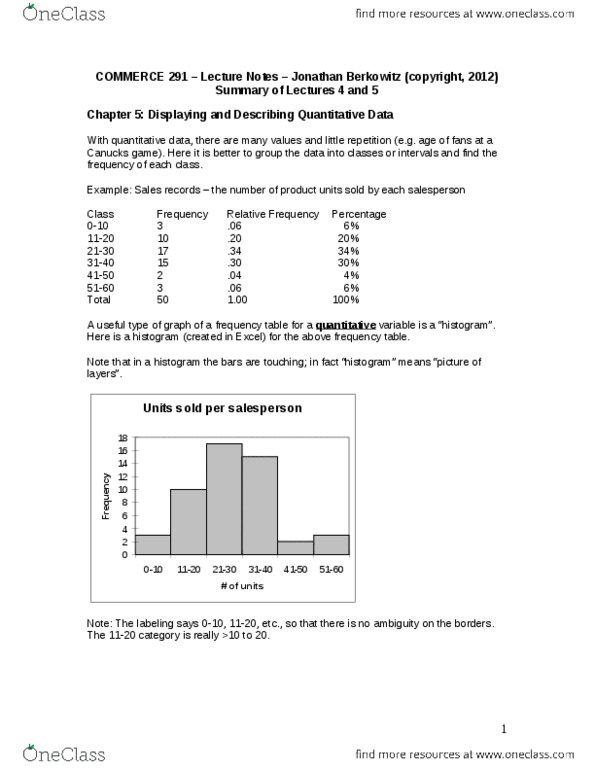
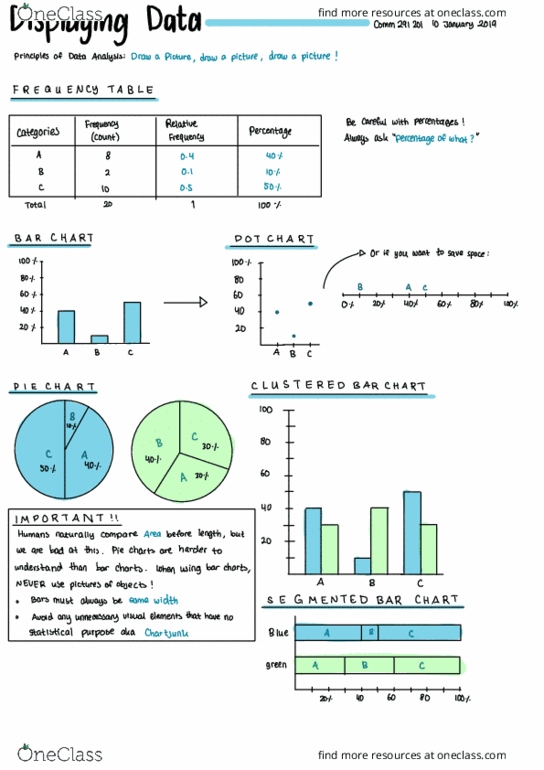
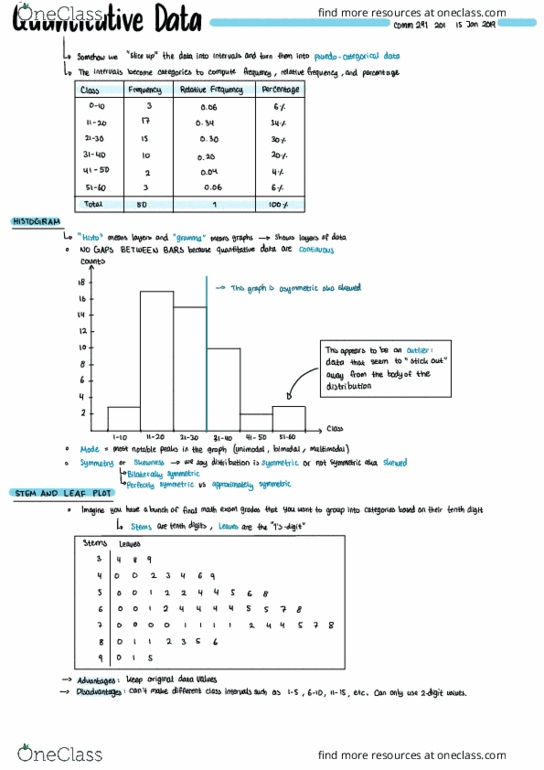
Somehow we slice up the data into intervals and turn them into puedo - categorical data. The intervals become categories to compute frequency , relative frequency , and percentage. Histo means layers and granma means graphs is shows layers of data. This appears to be an outlier data that seem to stick out from away. Mode most notable peaks in the graph ( unimodal bimodal l. Skewness a we say distribution is symmetric or not symmetric aka skewed. Bilaterally symmetric perfectly symmetric us approximately symmetric o. Imagine you have a bunch of final math exam grades that. You want to group into categories based on their tenth digit stems are tenth digits , leaves are the. Catch data entry errors line graphs show these very well to show longitudinal data o longitudinal data. 0 the peaks and troughs in a line graph can show significant events.