COMM 291 Lecture Notes - Lecture 6: Scatter Plot, Standard Deviation

COMM 291 verified notes
6/11View all
Document Summary
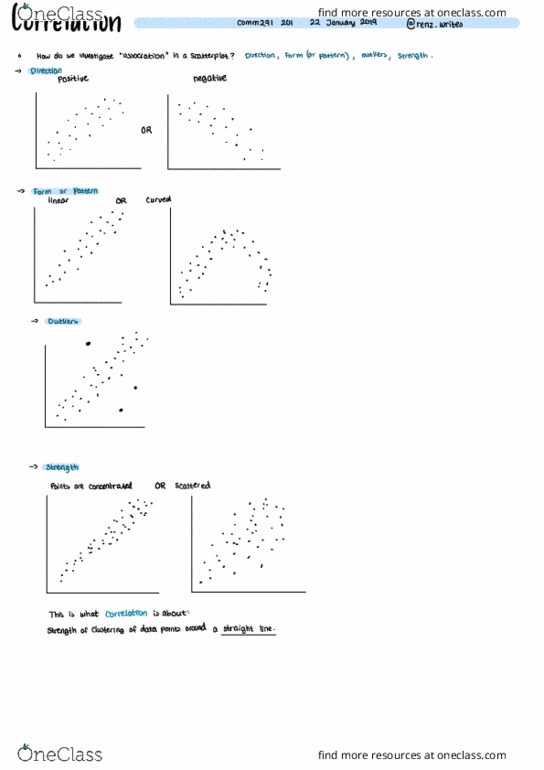
How do we investigate association in a scatter plot. This is what correlation is about strength of clustering of data points around a straight line . a l a f. Is sign indicates negative or positive correlation no units and. Not affected by unit conversions centre or spread roles of. Be careful of outside or lurking variables a something else that explains the correlation between. "t extrapolate based on correlation because you don"t have data ! o o o o o. Not for curved trends such as salary vs age : use. Don "t look at the correlation of averages. How do you smooth out the scatter in a scatter plot ? a. Tracing the median o what is the best fitting line. But there is an outlier vertical deviation residual aka error owe measure the vertical residual actual. "i u u distance from line of best fit aka vertical deviation la ei.