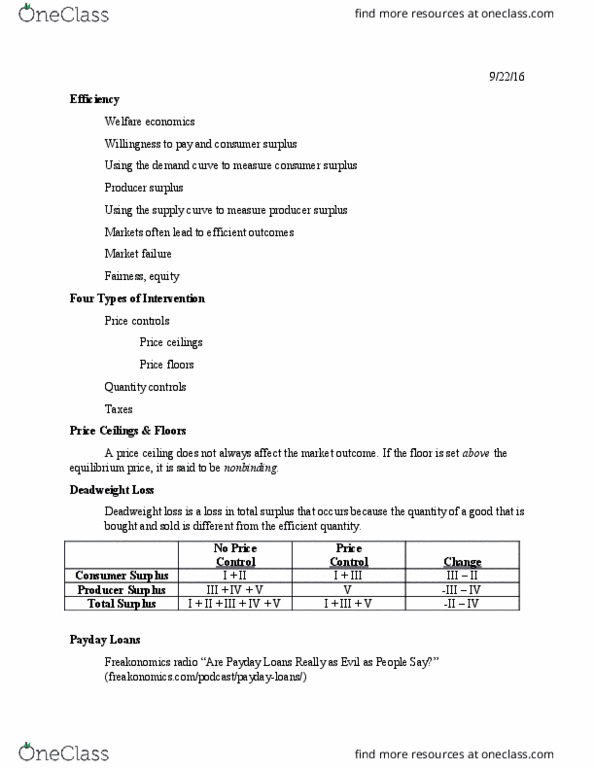
Under a binding price ceiling, what does the change in consumer surplus represent?
A) The gain in surplus for those buyers who can still purchase the product at the lower price.
B) The loss in surplus for those buyers who previously purchased some units of the good at the higher price, but these units are no longer produced at the lower price.
C) The loss in surplus for those buyers who would like the purchase the excess demand created by the price ceiling policy.
D) Both A and B are correct.
E) Both A and C are correct.
When the market price is held above the competitive level, the deadweight loss is composed of:
A) producer surplus losses associated with units that used to be traded on the market but are no longer exchanged.
B) consumer surplus losses associated with units that used to be traded on the market but are no longer exchanged.
C) producer and consumer surplus losses associated with units that used to be traded on the market but are no longer exchanged.
D) There is no deadweight loss if the government uses a price floor policy to increase the price.
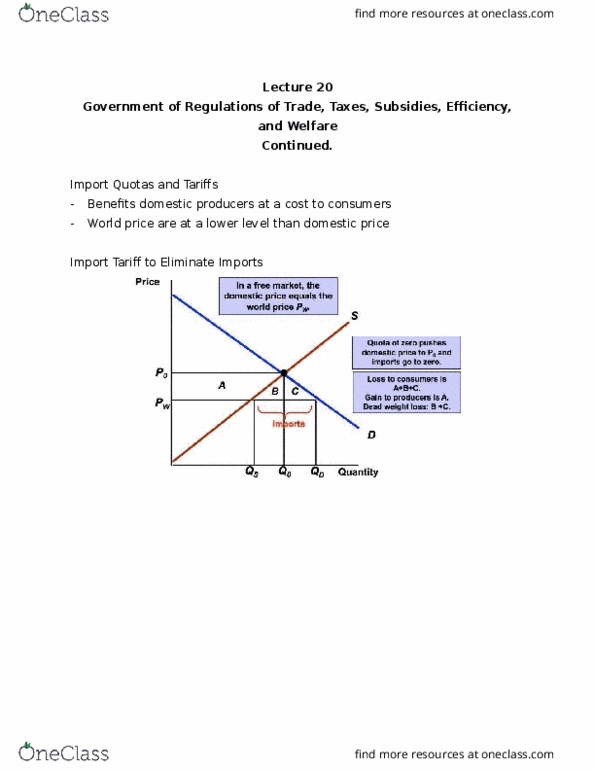
Compared to a tariff, an import quota, which restricts imports to the same amount as the tariff, will leave the country as a whole
A) worse off than a comparable tariff.
B) not as bad off as a comparable tariff.
C) about the same as a comparable tariff.
D) Any of the above can be true.
What is the welfare impact of a subsidy policy?
A) Producer surplus increases, consumer surplus declines, and total welfare declines.
B) Producer and consumer surplus increase, and these gains are larger than the government cost.
C) Producer and consumer surplus increase, and these gains are smaller than the government cost.
D) Producer surplus increases, consumer surplus declines, and total welfare increases due to the subsidy program.
Why is there a deadweight loss associated with subsidy payments?
A) There is no deadweight loss from a subsidy.
B) Quantity supplied is less than the equilibrium amount, so consumers and producers lose surplus value on those units that are no longer produced.
C) Quantity supplied exceeds the equilibrium amount, and consumer willingness to pay for these additional units is smaller than the marginal cost of producing them.
D) The subsidy payment does not distort quantities in the market, but the government cost exceeds consumer willingness to pay for the quantity demanded.