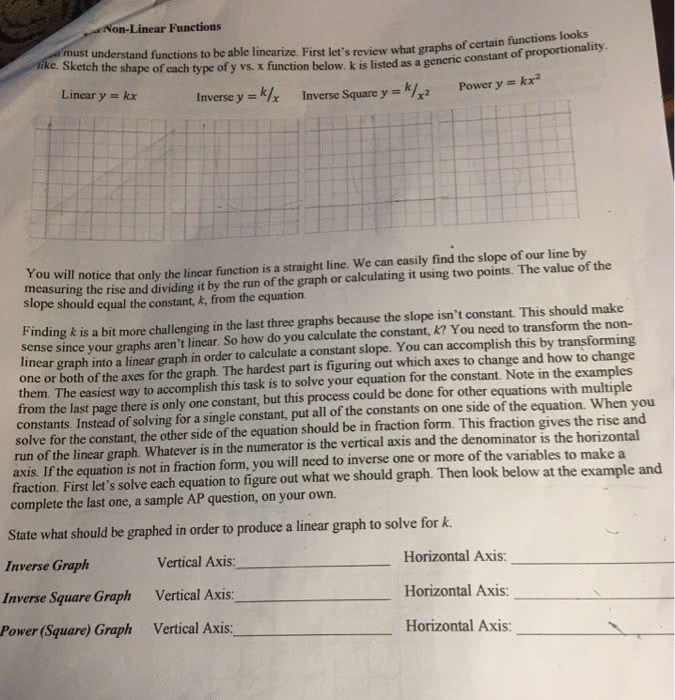
must understand functions to be able linearize. First let's review what graphs of certain functions looks like. Sketch the shape of each type of y vs. x function below. k is listed as a generic constant of proportionally. Linear y = kx Inverse y = k/x Inverse Square y = k/x^2 Power y = kx^2 You will notice that only the linear function is a straight line. We can easily find the slope of our line by measuring the rise and dividing it by the run of the graph or calculating it using two points. The value of the slope should equal the constant, k, from the equation. Finding k is a bit more challenging in the last three graphs because the slope isn't constant. This should make sense since your graphs aren't linear. So how do you calculate the constant, k? You need to transform the non-linear graph into a linear graph in order to calculate a constant slope. You can accomplish this by transforming one or both of the axes for the graph. The hardest part is figuring out which axes to change and how to change them. The easiest way to accomplish this task is to solve your equation for the constant. Note in the examples from the last page there is only one constant, but this process could be done for other equations with multiple constants. Instead of solving for a single constant, put all of the constants on one side of the equation. When you solve for the constant, the other side of the equation should be in fraction form. This fraction gives the rise and run of the linear graph. Whatever is in the numerator is the vertical axis and the denominator is the horizontal axis. If the equation is not in fraction form, you will need to inverse one or more of the variables to make a fraction. First let's solve each equation to figure out what we should graph. Then look below at the example and complete the last one, a sample AP question, on your own. State what should be graphed in order to produce a linear graph to solve for k. Inverse Graph Vertical Axis: _____ Horizontal Axis: _____ Inverse Square Graph Vertical Axis: _____ Horizontal Axis: _____ Power (Square) Graph Vertical Axis: _____ Horizontal Axis: _____