MATH 302 Lecture 2: Indicator function

Document Summary
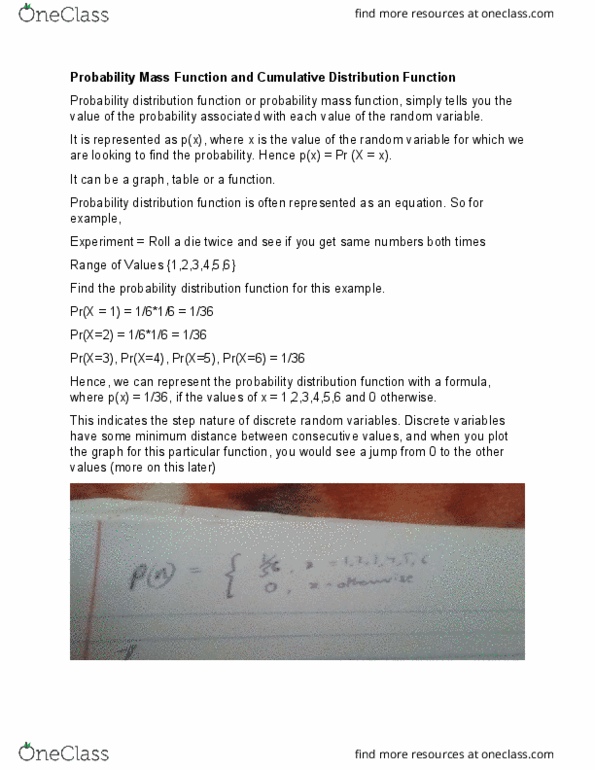
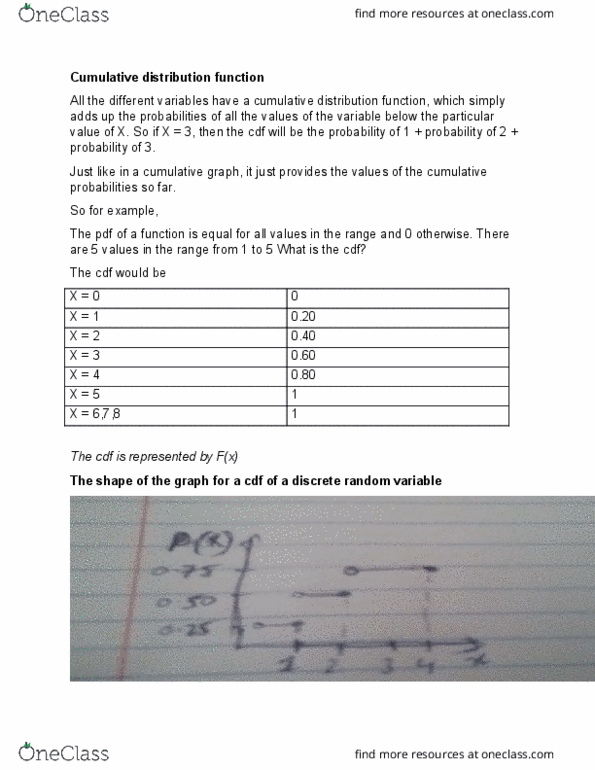
This brings us to the topic of the indicator function which is simply the value 1 if the value of x is a value that is permitted in the range of the experiment and 0 otherwise. So in this case, i can represent p(x) as 1/36 * i(x) One thing to note is that the value of the probability will be greater than 0, if the value of x is within the range of the function and 0 otherwise. And as is the general case, the sum of the probabilities of all the x values would equal to 1. What this means is that for every value of the variable that has a probability greater than 0, the graph will jump up from its previous value.