PSYC 101 Lecture Notes - Lecture 5: Skewness, Descriptive Statistics, Statistical Inference


55
PSYC 101 Full Course Notes
Verified Note
55 documents
Document Summary
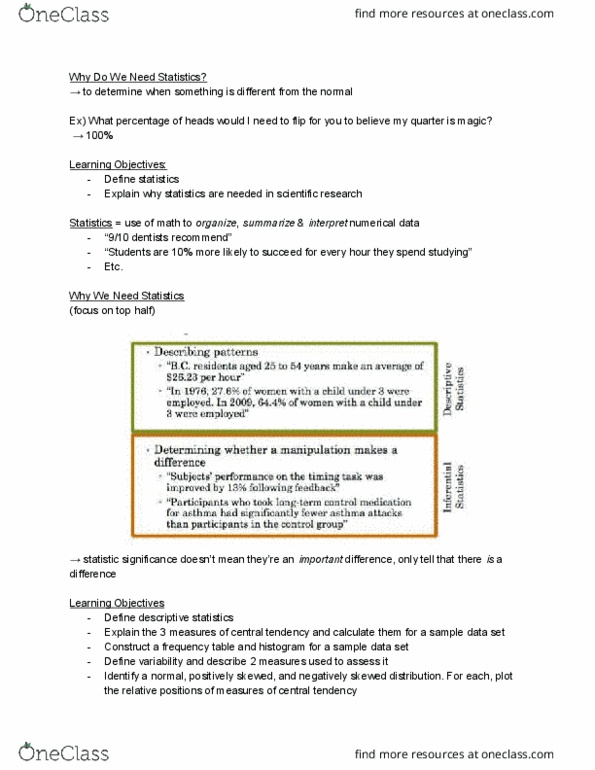
Why use statistics? to summarize and organize our sampled data using descriptive statistics. To use sampled data to make reasonable inferences about the greater population does the pattern mean something? inferential statistics. Standard deviation: measure of the dispersion from the mean. When a frequency distribution is normal; the mean, median and mode are all the same. When it is positively skewed, or negatively skewed, these three measures of central tendency are quite di erent. Correlation coe cient (r) positive: r = 1 negative: r = -1 no correlation: r = 0. The correlation is strong when it is closer to 1. The correlation i weak when it is closer to 0. If x (exposure to media violence) and y (aggressiveness) are correlated, then there are at least three possible explanations: Z (some other factor, such as lack of adult supervision) causes both. Y and x > the third-variable problem (schacter) causing both of these things.