SSCI 2910U Lecture 8: Week 12- Association Between Variables Measured at the Interval- Ratio Level & Multiple Regression and Correlation

31 Mar 2018
School
Department
Course
Professor
Document Summary
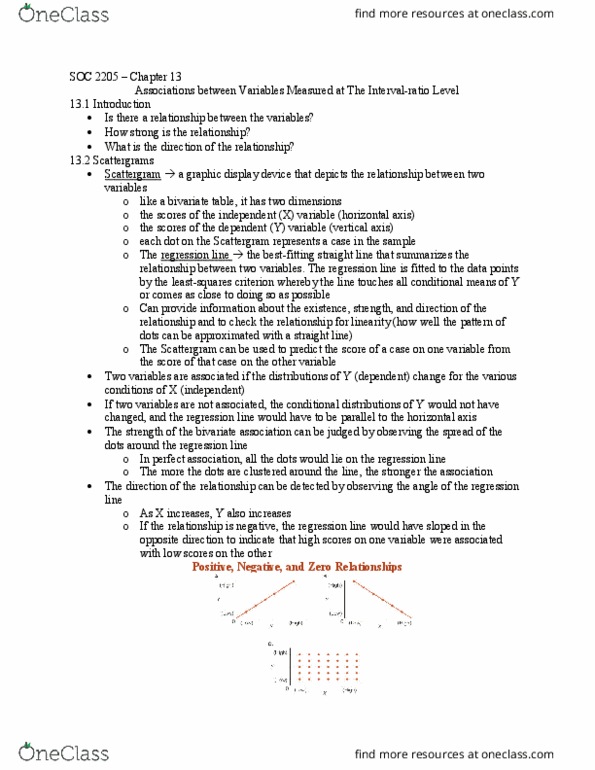
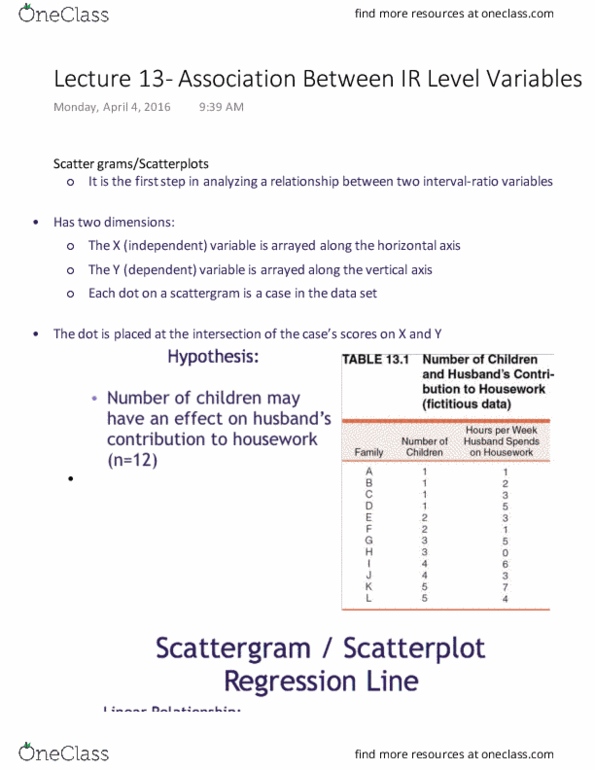
Week 12 lecture 8 association between variables measured at the interval- Scattergrams: scattergrams display relationships between two interval-ratio variables, scattergrams have two dimensions: The x (independent) variable is arrayed along the horizontal axis. Shows a scattergram displaying the relationship between these variables. Scattergrams: regression line: regression line is a single straight line that comes as close as possible to all data points. Sattergrams: strength of regression line: regression line indicates strength and direction of the linear relationship between two variables. The greater the extent to which dots are clustered around the regression line, the stronger the relationship. Scattergrams: direction of regression line: negative: regression line falls left to right, positive: regression line rises left to right. This a positi(cid:448)e (cid:396)elatio(cid:374)ship: as (cid:374)u(cid:373)(cid:271)e(cid:396) of (cid:272)hild(cid:396)e(cid:374) i(cid:374)(cid:272)(cid:396)eases, hus(cid:271)a(cid:374)d"s housework increases. Regression line- formula: this formula defines the regression line: y = a + bx. Y = score on the dependent variable.