CMN 3102 Lecture Notes - Lecture 3: Descriptive Statistics, Frequency Distribution, Construct Validity

23 Feb 2016
School
Department
Course
Professor


7
CMN 3102 Full Course Notes
Verified Note
7 documents
Document Summary
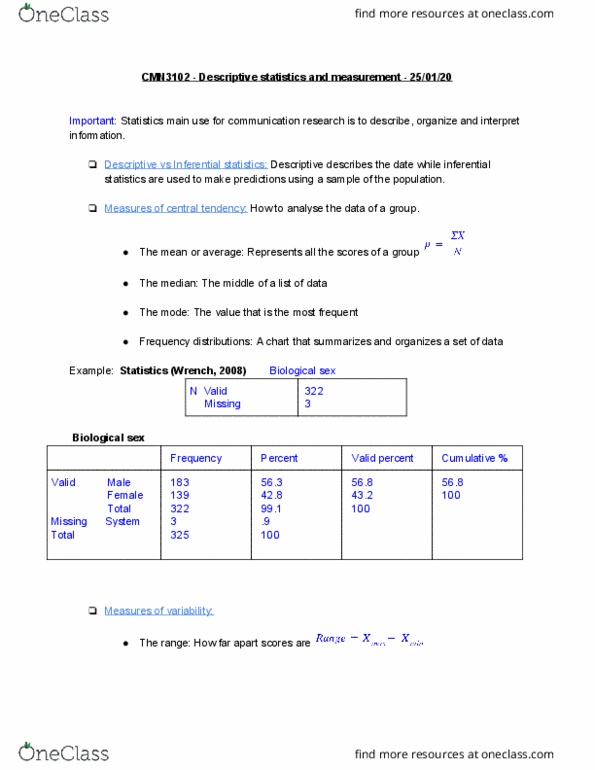
Frequency distribution: percentage distribution of the variable of. Tables or charts that summarize the distribution of a variable o! Can be used for all types of variables. Graphs/charts can be used to illustrate frequency distributions o! bar charts o! pie charts o! line charts o! histograms. The median: middle value o! nominal variables, ordinal, and interval/ratio variables o! ordinal and interval-ratio variables o! Measurement validity (or construct validity): involves the question, Are you measuring what you want to measure?" o! Does a survey question about prejudice to other groups actually measure prejudice. Reliability: measuring o! is achieved if the same or similar results are found each time a particular measurement technique is used on the same subject o! Refers to accuracy that a measure has in producing stable, consistent measurement. Finding frequency distributions and types of variables/level of. Is used for variables that measure the same concept or related concepts.