CHM110H5 Lecture Notes - Lecture 1: Paper Chromatography
86 views1 pages

9 Apr 2018
School
Department
Course
Professor
Document Summary
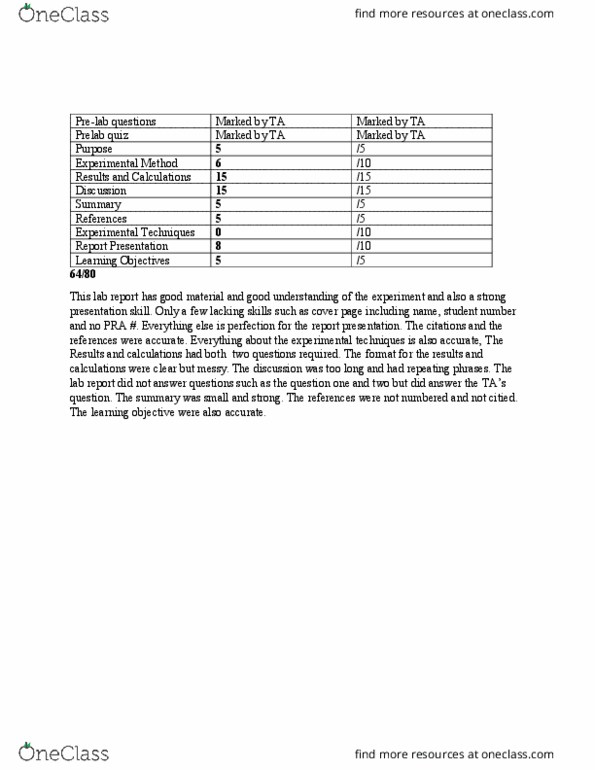
Experiment 1: separation of transition metal cations with the use of paper chromatography. This lab report has good material and good understanding of the experiment but poor presentation skills. Lacking simple"s steps like, double- spaced, with no coverage including your name, student number, and no pra#. The lab report has a positive look on the times new roman, pt12 and including title of the experiment. The lab report had no citation and did not mark any of the research done, it may be an act of plagiarism. Starting from the experimental method, it was clear and understandable but the steps to the procedure was not clear. The results and calculations had no graph and answered one questions from the two questions required. The format for the results and calculations were clear but messy. The discussion was too long and had repeating phrases.
Get access
Grade+20% off
$8 USD/m$10 USD/m
Billed $96 USD annually

Homework Help
Study Guides
Textbook Solutions
Class Notes
Textbook Notes
Booster Class
40 Verified Answers
Class+
$8 USD/m
Billed $96 USD annually

Homework Help
Study Guides
Textbook Solutions
Class Notes
Textbook Notes
Booster Class
30 Verified Answers
Related Documents
Related Questions
Hi, I have a lab and have provided the information below and the data calculated at the end. Please help in prelab questions and postlab questions. WIll rate really good if it's correct. Thanks a lot.


DATA (The total liquid should be 50ml, not more than that)
| SNO. | NACLO (intial temperature) | THE (B) Liquid temperature | NaClo(g) | The B solution(g) | FINAL temperature(together) |
| 1 | 21.7 | 21.5 | 10ml | 40ml | 30.4 |
| 2 | none | 21.5 | 0ml | 50ml | 21.5 |
| 3 | 21.8 | none | 50ml | 0ml | 21.8 |
| 4 | 21.9 | 21.7 | 20ml | 30ml | 38.4 |
| 5 | 21.9 | 21.7 | 30ml | 20ml | 37.4 |
| 6 | 22.0 | 21.7 | 40ml | 10ml | 28.8 |
| 7 | 22.1 | 21.9 | 25ml | 25ml | 42.2 |
Mole ratio lab v3b Rukes APChemistry Determination of the mole ratio of a chemical reaction The method of continuous variations is a means of determining the stoichiometric mole ratio of the reactants in a chemical reaction. The stoichiometric ratio, as given by the coelficients in the balanced chemical equation, represents the ratio at which chemicals must be combined to produce al product with no excess rcactant. Sincc there is no âwasted" reactant, the maximum amount of product is made for the given amount of both reactants. In themethod of continuous variations, several trials are performed. In each trial, there is a fixed amount of total reactant (measured by moles or volume or mass, etc.), but with the two reactants mixed together in different ratios. Some measure of the amount of product is made for each trial (volumc of gas produccd, mass of precipitate, color of product solution, etc.). When the amount of product is maximized, the stoichiometric ratio has been used. A similar technique fixes the amount of one reactant and increases the other until the maximum amount of product is reached In this lab the two chemicals being mixed are solutions of known molarity. The total volume of solutions is kept constant over several trials. The chemicals will release heat when mixed together and raise the temperature of the mixture. Since the volume of the solutions mixed is held constant, the temperaturc changc recorded wl be proportional to the amount of heat produced and therefore also the "anount of reaction" that occurred. Objectives - To graphically determine the stoichiometric mole ratio of a reaction. CAUTIONS: All solutions are basic and can be harmful to skin and eyes. Sodium hypochlorite can also bleaclh clothing. Wear goggles, gloves and aprons. ︵ Pre-lab: complete on a separate sheet. 1. Accurately graph the following data gathered from an experiment which mixes 0.5 M solutions of AgNO3 and K2CrO4. The x-axis should plot the volume of AgNO3 reading Irom lef to right (or the volume of K2CrO4 reading from right to left.) Draw two best fit lincs, one for the "up" slope and one for the "down" slope... see example to the right of the data. (Also consult your graphing skills handout if you have not yet drawn a graph) trial mL AgNO3 mL K2CrO mass of precipitate (g) 45 35 25 20 15 10 shape of graph 15 25 30 35 40 45 5.0 4 10.0 9.9 6.6 3.3 a) Use the intersection of best fit lines to find the theoretical maximum amount of product. b) Use the x-values to find the stoichiometric volume ratio c) Use the answer from b) and given molarities to find the stoichiornetric mole ratio d) How many values were used to plot your "up" line? How many values were used to plot your "down" line? 2. What single temperature change should be recorded if 10 mL of solution A at 20°C is mixed with 10 mL of 3. What single temperature change should be recorded if 10 mL of solution A at 20°C is mixed with 30 mL of 4. List four dependent variables that are often used for the method of continuous variations. Are these enough values to plot a good line? solution B at 24.0°C and the final temperature reaches 28.0°C? solution B at 24.0°C and the final temperature reaches 28.0°C?