ECO100Y5 Lecture Notes - Lecture 8: Perfect Competition, Marginal Product, Marginal Cost

ECO100Y5 verified notes
8/13View all

Document Summary
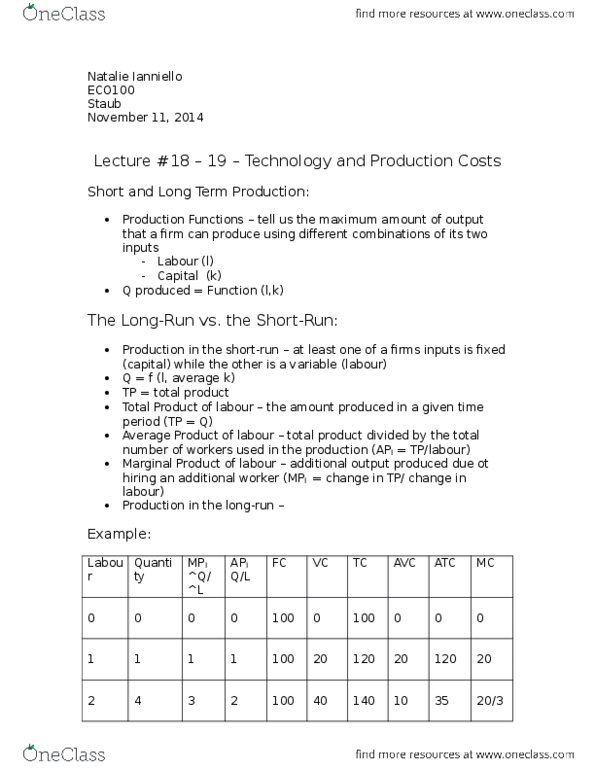
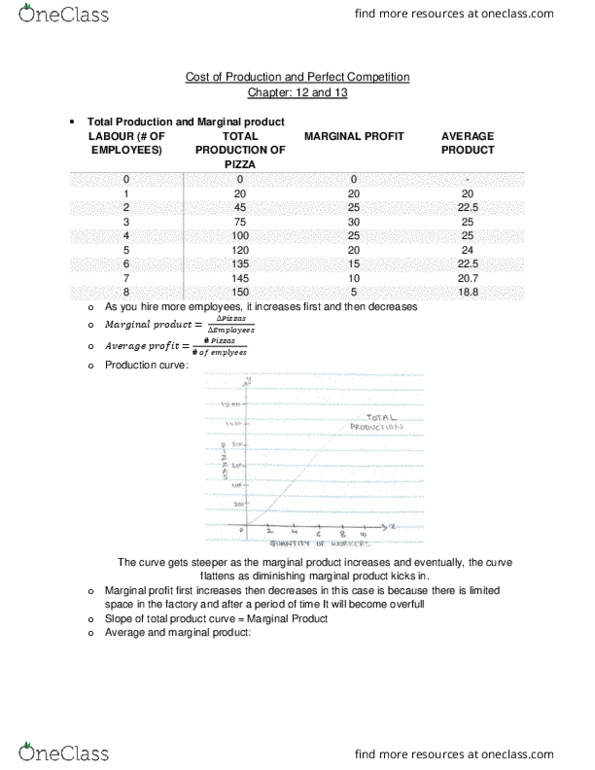
Chapter: 12 and 13: total production and marginal product. 18. 8: as you hire more employees, it increases first and then decreases, (cid:1859)(cid:1866) (cid:1868)(cid:1867)(cid:1856)(cid:1873)(cid:1855)(cid:1872)= We can see in the above graph that initially, adding more workers increases marginal product. This can be seen as the mirror image of the marginal product curve. Average fixed curve trends downward, average variable cost and average total cost is u-shaped: marginal cost curve. The marginal cost curve us u-shaped and as mc falls, the marginal product increases. Mc = ( tc / l) / ( q / l) It however, does not refer to a certain number, of days, months or years; it varies from firm to firm. In the long run, firms might be able to lower costs further. This is the graph for the kind of demand that has a perfectly competitive firm face for its product; it is perfectly elastic.