GGR278H5 Lecture Notes - Lecture 5: Grid Cell, Data Compression, Gif


Document Summary
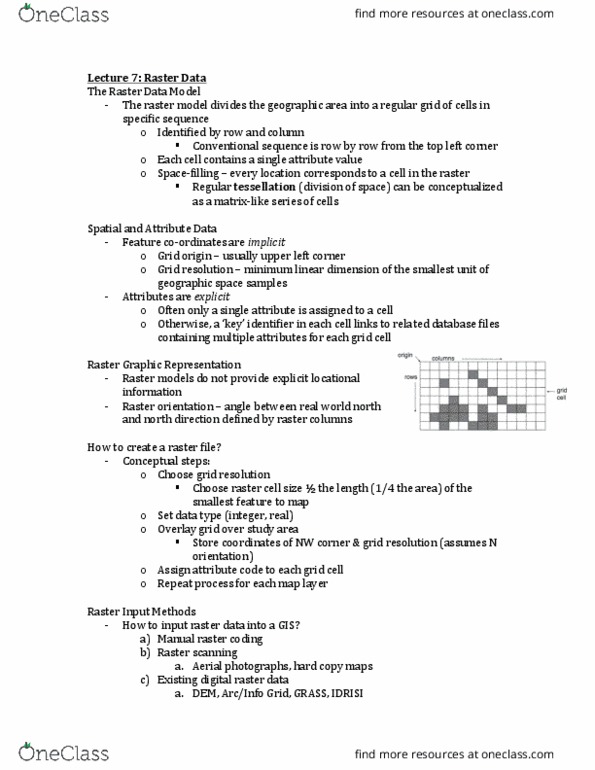
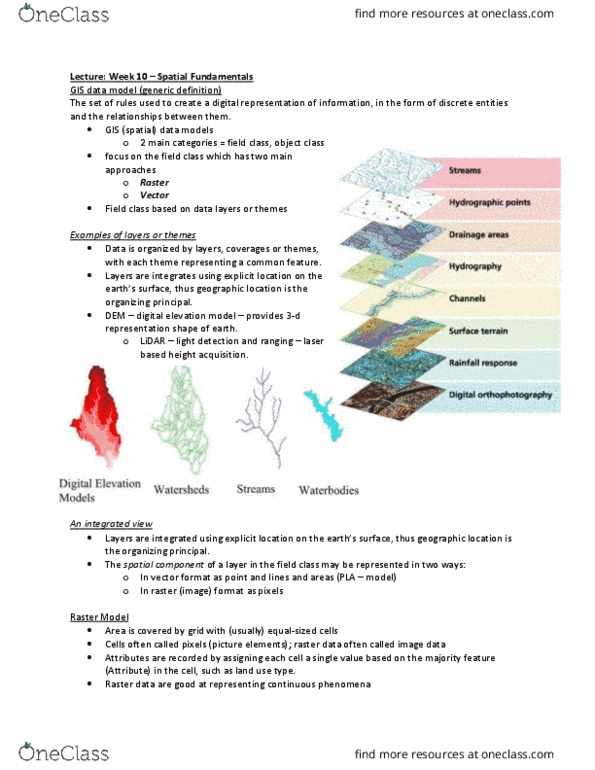
There are two ways to visualize gis data in arcmaps: raster layers and vector layers. Raster layers are organized in a grid of identically sized cells, called pixels . Each cell has its own individual attribute data. Raster data models are used to represent both objects and fields. It is organized in a cellular format. Dividing the space into a series of units. Each unit (or cell) is generally the same size. Grid cells is the most common raster representation model. Jpeg, gif, bmp and tif are raster formats. Tessellation: is a gridded representation of a plane surface into disjoint polygons. These polygons are normally either square (raster), triangular (tin) or hexagonally. These models can be built into hierarchical structures, and have a range of algorithms available to navigate through them. A (regular or irregular) 2d tessellation involves the subdivision of a. 2-dimensional plane into polygonal tiles (polyhedral blocks) that completely cover a plane.