POL242Y5 Lecture Notes - Lecture 14: Standard Deviation

28 Sep 2020
School
Department
Course
Professor
Document Summary
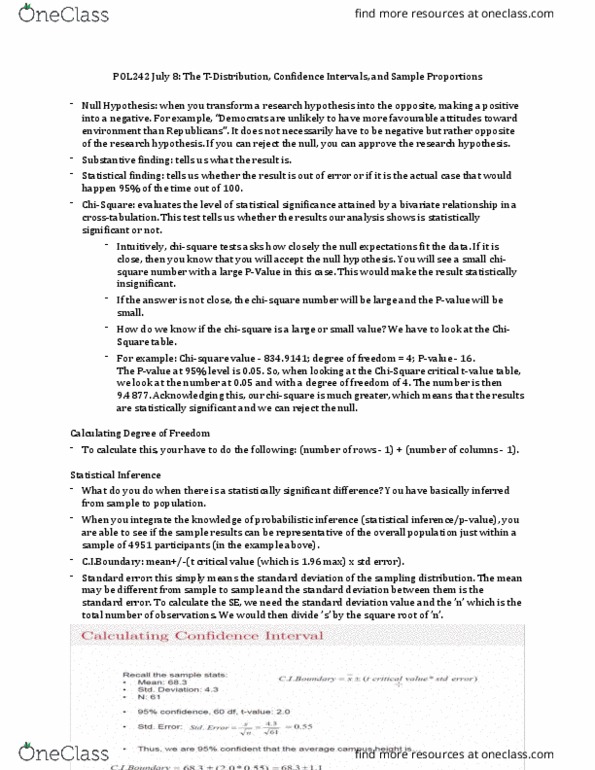
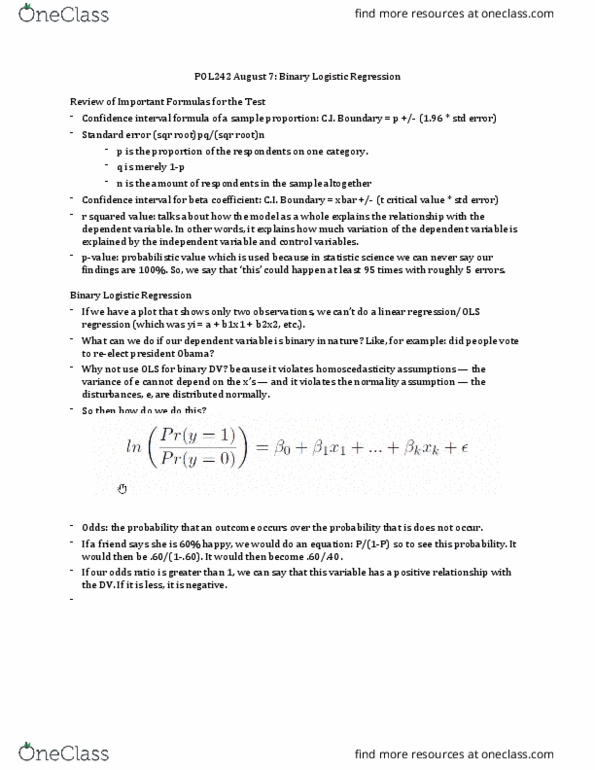
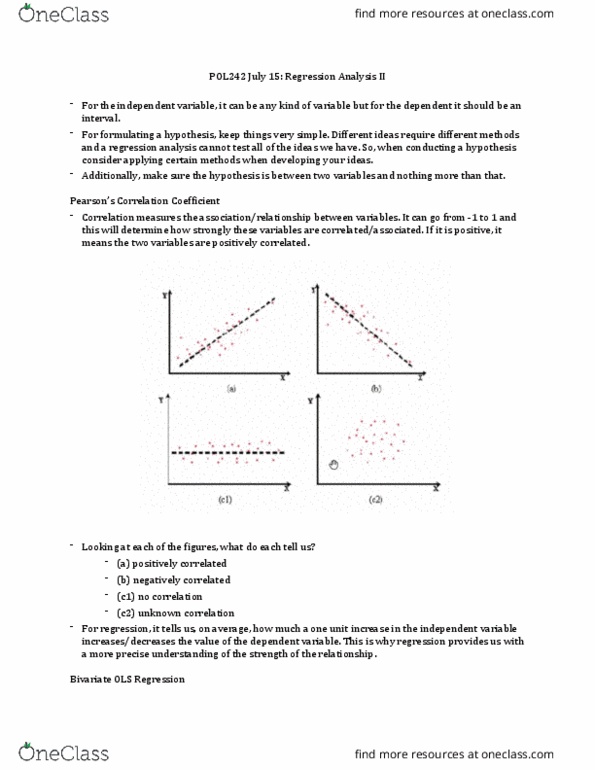
Pol242 july 10: bivariate (two-variable) regression analysis i. In categorical level variables we do not have a mean or standard deviation. But they are crucial for getting the ci. Proportion range goes from 0 to 1. The p is the sample proportion with a characteristic. We also need to calculate the standard error for ci and to get this we usually need standard other proportion would be q which would equate to 1 - p. q" would be the opposite of the p. Instead the equation would be se = pq(square. What is the interval limitations to be 95% sure the sample of deviation. root)/n(square root). Standard error: . 27 x (1 - 0. 73) (square root)/ 1500 (square root). Correlation measures the association/relationship between two interval variables. Pearson"s r could be between -1 to 1. A positive value tells you both the dv and iv increase together (perfect correlation). A negative says that they are inversely related.