PSY202H5 Lecture Notes - Lecture 3: Sat, Variance, Standard Deviation


Lecture 3
Theoretically, what could happen when you administer a treatement to a population?
• Does it change the mean, nature of the distribution or st.d of the population, or both std.
and mean
Potential types of changes to a population of scores
• Change the mean and nothing else
• Change the st.d without affecting the mean
• Change both the mean and std.
• Change other parameters of the distribution (eg. Its skew)
• Change the shape of the distribution
• Change two or more of the above
Testing hypotheses concerning variances
• Why variance
o There are Times when we want to know whether
▪ The variability in a sample is representative of the variability in the
population
▪ Whether the measures in one group are as variable as the measures in
another group are as variable as the measures in another group
▪ We also need to analyze variances because the analysis of multi-group
designs is essentially an analysis of variance (ANOVA)
Example 1
• There are occasions in which we know how measures are distributed in a population. For
example, the Scholastic Aptitude Test (SAT) is taken by all applicants to U.S.
Universities. Hence the company that administers the test has a data base containing the
scores of all of the U.S. students who have taken the test. Furthermore they know and
state that these scores are normally distributed. They also publish the population mean
score and the population standard deviation each year. For the current year, the
population mean is μ = 430, and the population standard deviation is σ = 28. As Dean of
Education at a major Canadian University, you want to know how the applicants to your
University compare to the U.S. applicants. To find out you ask a random sample of 71
applicants to your University to take the SAT. Are your applicants typical of U.S.
students?
• want to know
o is the distribution the same
o is the mean the same
o is the std. the same
• if we know the population mean and st.d we can use the z distribution
• to determine the distribution construct a frequency histogram
• reject the null because Msx was in the rejection region
• if we reject the pop. Variance is the same, then we can use the t test because we cannot
use the z distribution
• *if the pop std. is not what you think it is then you should be using a t distribution
find more resources at oneclass.com
find more resources at oneclass.com

Questions to ask
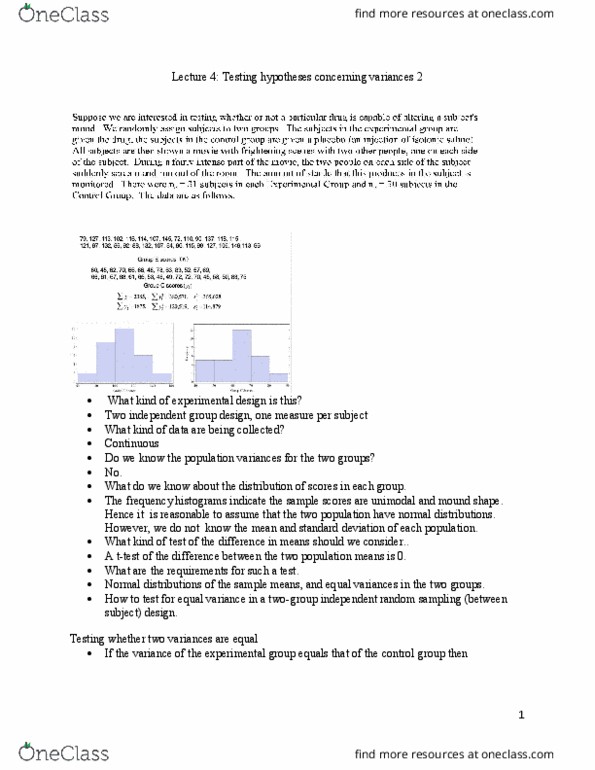
• what kind of experimental design is this?
o Single group, single measure, per person, continuous data, pop mean and std.
known if the null hypothesis is true
• What questions do we want to have the data answer
o Is the population mean for Canadian students the same as for U.S students ?
o Are the Canadian applicants as variable as U.S applicants
• Specify the null hypothesis concerning variances in words
o Canadian students are as variable as U.S students
• Specify the research hypothesis in words
o The among of variability for Canadian students differs from that of their U.S
counterparts
• State the null and research hypotheses statistically
o
find more resources at oneclass.com
find more resources at oneclass.com
Document Summary
Theoretically, what could happen when you administer a treatement to a population: does it change the mean, nature of the distribution or st. d of the population, or both std. Example 1: there are occasions in which we know how measures are distributed in a population. For example, the scholastic aptitude test (sat) is taken by all applicants to u. s. Hence the company that administers the test has a data base containing the scores of all of the u. s. students who have taken the test. Furthermore they know and state that these scores are normally distributed. They also publish the population mean score and the population standard deviation each year. For the current year, the population mean is = 430, and the population standard deviation is = 28. Education at a major canadian university, you want to know how the applicants to your. To find out you ask a random sample of 71 applicants to your university to take the sat.