SOC222H5 Lecture Notes - Lecture 2: Frequency Distribution, Central Tendency, Standard Deviation


Document Summary
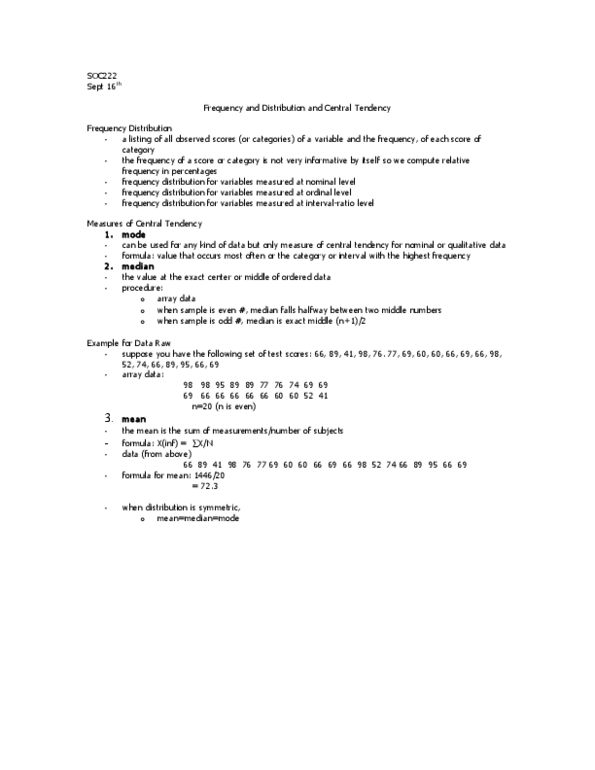
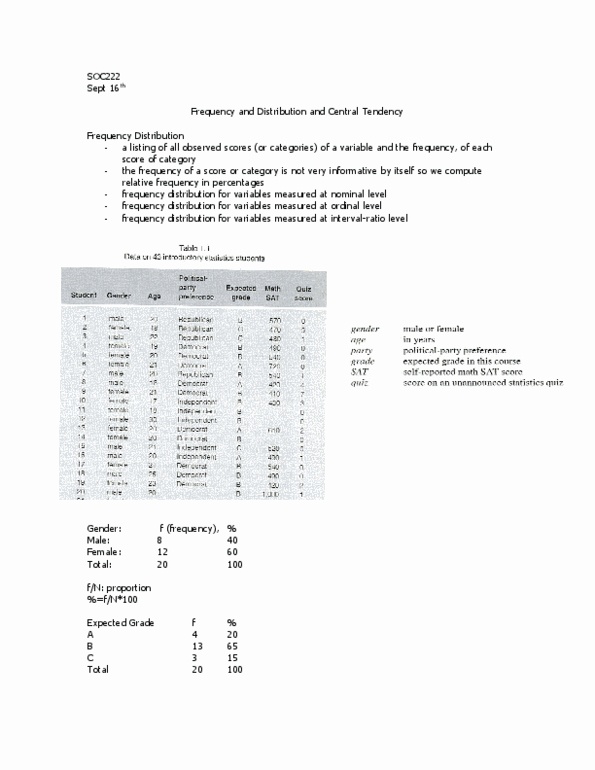
Soc222 - lecture 2; central tendency and dispersion. A listing of all observed scores (or categories) of a variable and the frequency, of. The frequency of a score or category is not very informative by itself so we compute each score or category relative frequency in percentages. Frequency distribution for variables measured at nominal level. Frequency distribution for variables measured at ordinal level. Pretty happy is the median for ordinal level data, it divides the categories in half. Frequency distribution for variables measured at interval-ratio level. Most occurred is the 22, so this is the mode. We can also find out the median. 22 is the median because that is when we reach 50% To calculate mean, add all the ages and divide by number of cases(?) Mode = can be used for any kind of data but only measure of central tendency for.