SOC222H5 Lecture Notes - Lecture 5: Interval Ratio, Spurious Relationship, Frequency Distribution

Document Summary
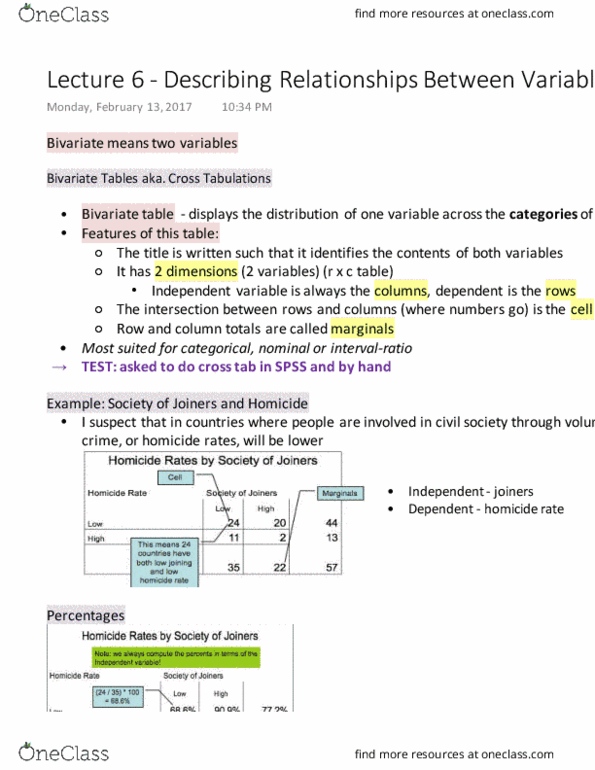
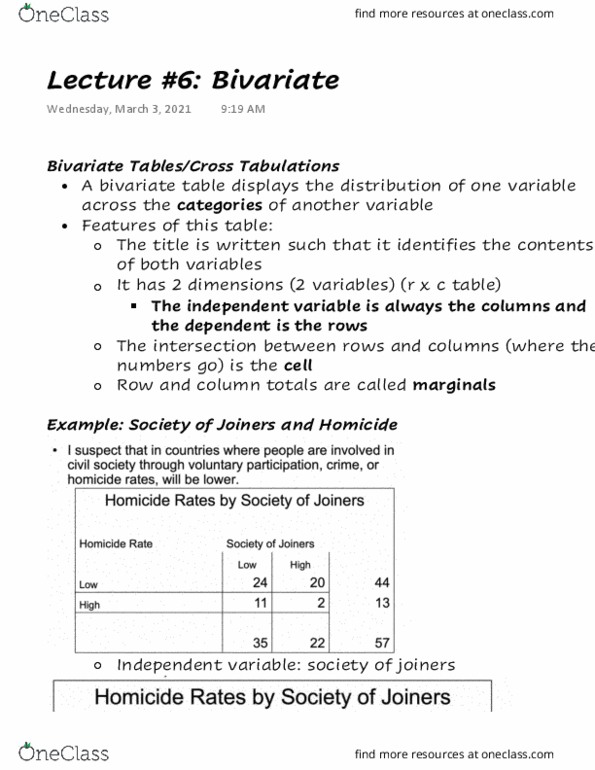
Cross-tabulation- arranging two nominal or ordinal variables in a table to analyze a potential relationship. To see whether there is any relationship between political identifications and their support for trump"s muslim ban. To determine how strong this relationship might be. Iv categories in columns and dv categories in rows. Cell: representing the count where the column and row variable interact in their respective categories. Column and row totals (marginals)- shows the frequency distribution for each variable. Referred to as an r x c table (number of rows by number of columns) or a 2 x 2 table, r x c changes depending on the number of variable categories. 2 rules for computing percentages in bivariate tables: Calculate the percentages within the category of each iv (divide value by column total) Interpret the table, compare the differences in percentages between the difference categories of the iv: 55% vs 21% is a substantial difference. Comparing percentages in a bivariate table: some tips.