SOC244H5 Lecture Notes - Lecture 2: Patrilineality, Participant Observation, Focus Group


September 15, 2016
Canadian Families: Context, Patterns, and Dynamics
Canadian Families
Profile of Canadian Families
Aboriginals
Migration and Families
Research Methods
Main themes
The influence of social structure on families
Diversity of family forms
Family dynamics
The integration of macro-level and micro-level perspectives
Profile of Contemporary Canadian Families
Are Canadian Families Becoming Smaller?
oIn 1961, 16% of Canadian families were made up of six or more persons,
compared with only 2.6% in 2002
oThe average size of the Canadian family decreased from 3.9 people in 1961 to
3.0 in 2001, and 2.9 in 2011
oIndividuals living alone made up 9% of all households in 1961; by 2001, they
accounted for 26%; and by 2011, 27.6%
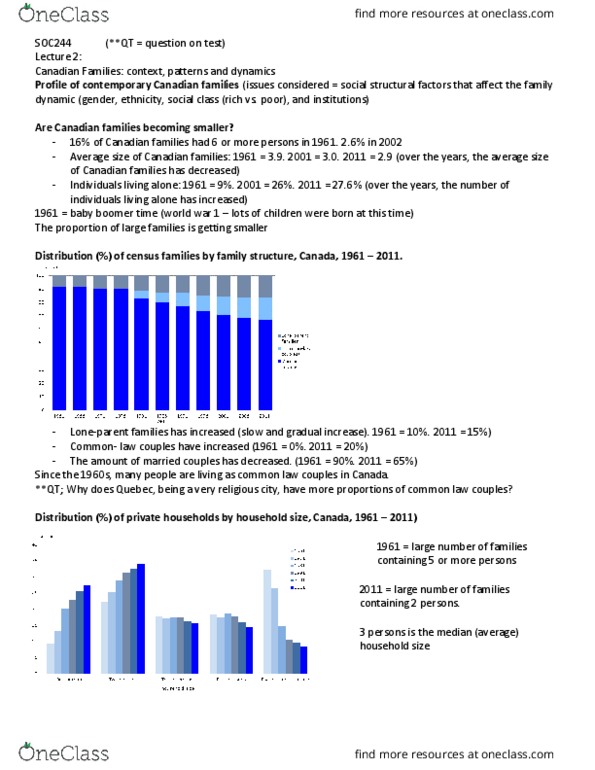
Distribution of census families by family structure
oLone-parent families are rising but not as much as common law partners
oCommon law couples show a more evident increase than lone parent couples
This means that married couples are decreasing due to
Distribution of private households
oThe protortion of small families such as one person are rising since 1961.
o2 people households are increasing as well in present times than in 1961
o3 and 4 people families have started to decrease presently
oMore supprisingly, 5 or more people in families have shown a significant drop in
numbers compared to 1961 at 30% to about 10% in 2011
Do Canadians delay their marriage?
oIt seems now that women and men have been delaying their marriage for
various reasons
oIn 1921, marriage for men was around 28 and women was 24, in 2008, both
genders are closer to 30 years old upon marriage
oAfter the second world war, when soldiers came back from war, they
immediately started producing and getting married therefore, they there getting
married at an early age which caused the drop from 1940-1975
Are divorce rates going up?
oThe rates are rising overtime but when it reaches their peak, it goes back down.
oTherefore, the divorce rates are not infinite
find more resources at oneclass.com
find more resources at oneclass.com
Document Summary
3. 0 in 2001, and 2. 9 in 2011: individuals living alone made up 9% of all households in 1961; by 2001, they accounted for 26%; and by 2011, 27. 6% Distribution of census families by family structure: lone-parent families are rising but not as much as common law partners, common law couples show a more evident increase than lone parent couples. This means that married couples are decreasing due to. Births per 1,000 women aged 15-49 in canada: there was high fertility in 1921, then declined, and started to rise again in 1945 after the second world war when soldiers came back. These children were known as the baby boomers. Percentage of elderly population: the percentage is rising steadily over time because of the baby boomers getting older. Same-sex couples: following the legalization of same-sex marriage in canada in july 2005, the 2006.