STA215H5 Lecture Notes - Lecture 15: Central Limit Theorem, Kanye West, Exit Poll


STA215; Chapter 15 - Sampling Distribution and CLT
●SAMPLING DISTRIBUTION
○ The sampling distribution of a statistic is the distribution of values taken by the
statistic in all possible samples of the same size from the same population
●EX: POPULATION PARAMETER
○ We have a population with a total of six individuals: A, B, C, D, E and F. All of
them voted for one of two candidates: Trump or Kayne West. A and B voted for
Kayne West and the remaining four people voted for Trump. Proportion of voters
who support Kayne West is p = 2/6 = 33.33% this is a population paramete
●(1) We are going to estimate the population proportion of people who voted for Kayne
West, p, using information coming from an exit poll of size two. The ultimate goal is
seeing if we could use this procedure to predict the outcome of this election
○ The proportion of people who voted for Kayne West in each of the possible
random samples of size two is an example of a statistic. In this case, it is a
sample proportion because it is the proportion of Kayne West supporters within a
sample; we use the symbol p(hat) to distinguish this sample proportion from the
population proportion, p
P(hat)
0
1/3
2/3
Frequency
4
12
4
Relative frequency
4/20
12/20
4/20
●(2) We are going to explore what happens if we increase our sample size. Now, instead
of taking samples of size 2 we are going to draw samples of size 3
○ Possible estimates:
○ MEAN of sample: 0.3333 = 33%
○ Proportion of times we would declare Kanye West lost the election using this
procedure = 16/20 = 80%
●3) Assume we have a population with a total of 1200 individuals. All of them voted for
one of two candidates: Kayne West or Trump. Four hundred of them voted for Kayne
West and the remaining 800 people voted for Trump. Thus, the proportion of votes for
Kayne, which we will denote with p, is p = 400 1200 = 33.33%. We are interested in
estimating the proportion of people who voted for Kayne, that is p, using information
coming from an exit poll. Our ultimate goal is to see if we could use this procedure to
predict the outcome of this election.
○ The larger the sample size, the more closely the distribution of sample
proportions approximates a Normal distribution.
○ The question is: Which Normal distribution?
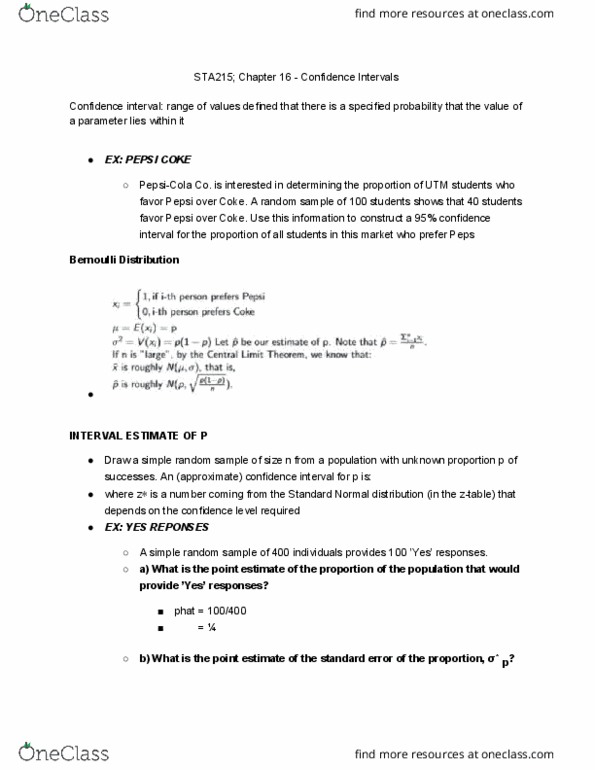
○ Draw an SRS of size n from a large population that contains proportion p of
”successes”. Let p(hat) be the sample proportion of successes,
○ P(hat) = [number of successes in the sample]/[n]
○ The mean of the sampling distribution of p(hat) is p
○ The standard deviation of the sampling distribution is: sqroot[qp(1−p)/n]