STA215H5 Lecture Notes - Lecture 20: Extrapolation, Point Estimation, Confidence Interval


STA215; Chapter 20-21 - Means
STANDARD ERROR; When the standard deviation of a statistic is estimated from data, the
result is called the standard error of the statistic. The standard error of the sample mean xbar is
s/√n
● Ex. Communitting
○A study of commuting times reports the travel times to work of a random
sample of 1000 employed adults. The mean is xbar = 49.2 minutes and
the standard deviation is s = 63.9 minutes. What is the standard error of
the mean?
○s/√n = 63.9/√1000 = 2.0207 minutes
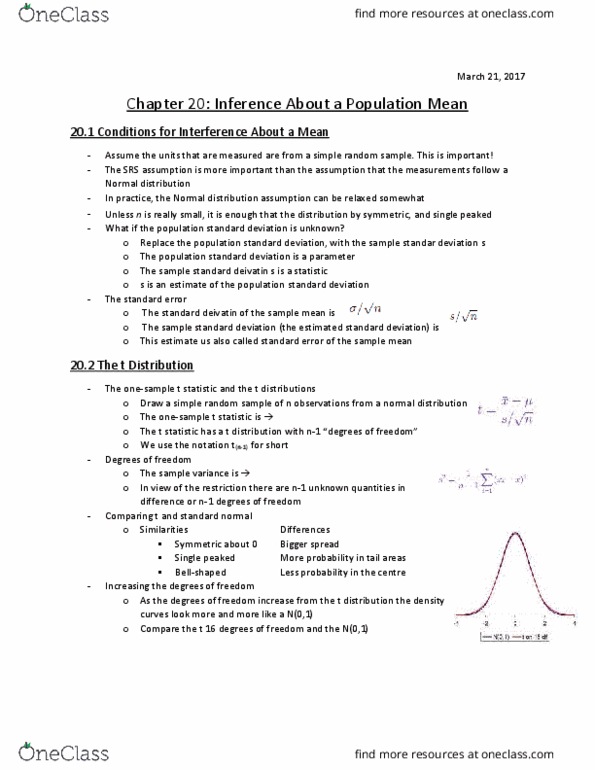
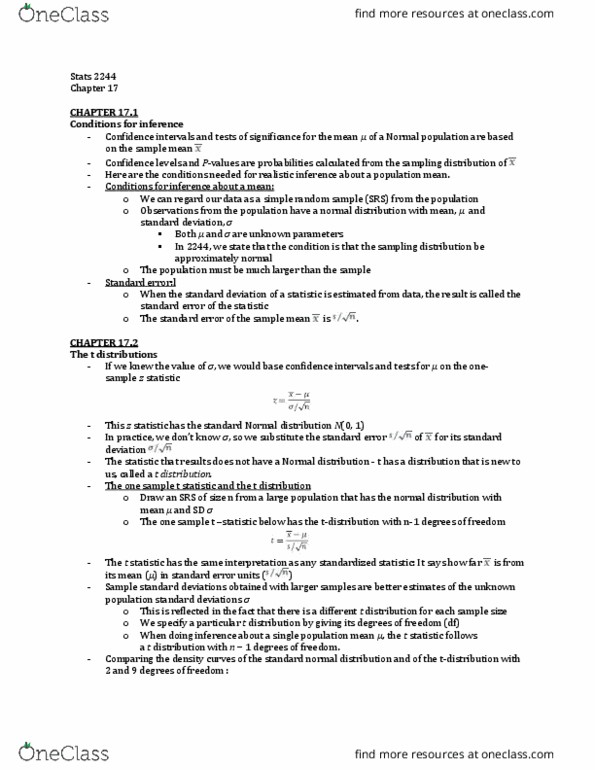
T-statistic & Distribution
●
● has the t-distribution with n-1 degrees of freedom
●(1) The density curves of the t distributions are similar in shape to the Standard
Normal curve. They are symmetric about 0, single-peaked, and bell-shaped
●(2) The spread of the t distributions is a bit greater than of the Standard Normal
distribution. The t distributions have more probability in the tails and less in the
center than does the Standard Normal. This is true because substituting the
estimate s for the xed parameter σ introduces more variation into the statistic
●(3) As the degrees of freedom increase, the t density curve approaches the
N(0,1) curve ever more closely. This happens because s estimates σ more
accurately as the sample size increases. So using s in place of σ causes only a
little extra variation when the sample is large.
●
●EX: CRITICAL VALUES
○ TABLE: gives t*, % that gives you a certain range of probability
○ Using the t-table, nd:
○ a) the critical value for a one-sided test with level α = 0.05 based on the
t(4) distribution
Document Summary
Standard error; when the standard deviation of a statistic is estimated from data, the result is called the standard error of the statistic. The standard error of the sample mean xbar is s/ n. A study of commuting times reports the travel times to work of a random sample of 1000 employed adults. The mean is xbar = 49. 2 minutes and the standard deviation is s = 63. 9 minutes. They are symmetric about 0, single-peaked, and bell-shaped. Has the t-distribution with n-1 degrees of freedom. (1) the density curves of the t distributions are similar in shape to the standard. (2) the spread of the t distributions is a bit greater than of the standard normal distribution. The t distributions have more probability in the tails and less in the center than does the standard normal. This is true because substituting the estimate s for the xed parameter introduces more variation into the statistic.