BIOC33H3 Lecture Notes - Lecture 2: Atrioventricular Node, Purkinje Fibers, Circulatory System

4 Jan 2017
School
Department
Course
Professor
Document Summary
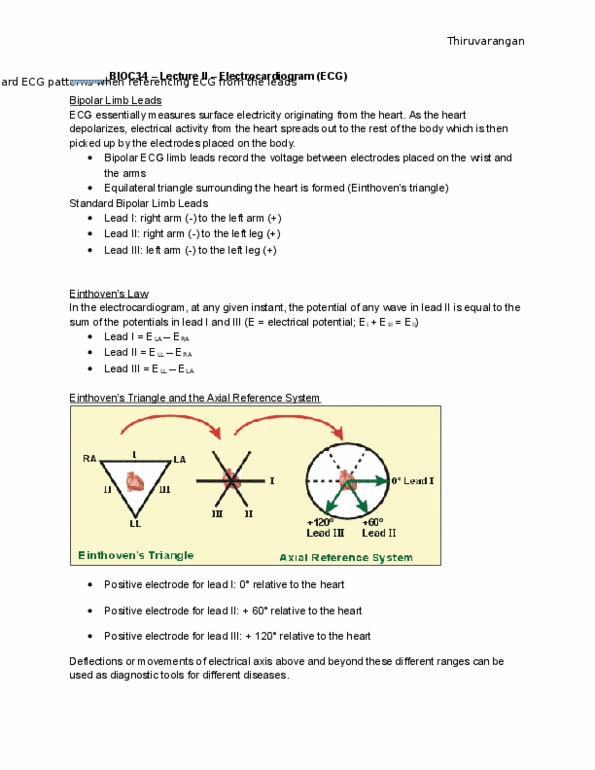
We can measure ecg using standard bipolar limb leads. A peak indicates a depolarization towards a + lead. Comparing electrical potentials in one limb to the combination of the two other limbs. 3 different vectors can be obtained: +90, -30, -150. Do not need to know all the different graphs. * only need to know lead ii bipolar limb lead graph to spot abnormalities in trace. Time between r peaks is heart rate: 60/r1-r2. P to q or r distance indicates time through av node to ventricles. Q to t distance indicates time ventricles are contracting (systole) T to q distance indicates time ventricles are relaxing (diastole) Can return to normal with exercise or holding breath. Other parts of the heart can trigger depolarization and would be called a wandering pacemaker. P waves will vary as well as pr distance. Sa however is faster to depolarize and has a much more quicker effect on heart rate than wandering pacemakers.