BIOC33H3 Lecture Notes - Left Ventricular Hypertrophy, Ventricular Hypertrophy, Obstructive Lung Disease

20 Mar 2013
School
Department
Course
Professor


Document Summary
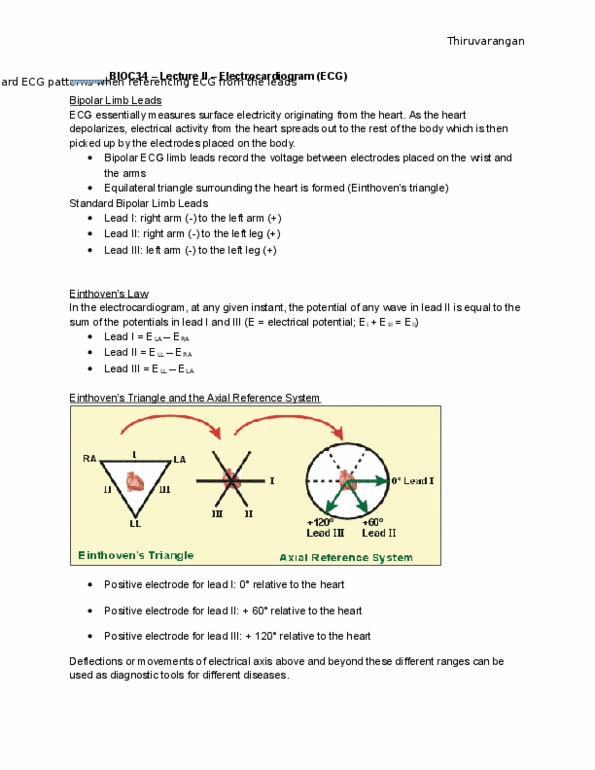
At any one instant the ventricles begin to depolarize and continue to conduct, there is a primary direction in which the electrical activity is flow at that very instant. Deviation to the right (above 120 degrees) Figure 1: the sum of electrical activity during the qrs complex identifies that the major direction of flow of electrical activity is about. Deviation to the left (less than 0 degrees) Increased left ventricular mass (left ventricular hypertrophy: hypertension - high blood pressure in the systemic circulation, aortic stenosis where the aortic valves doesn"t open properly (i. e. smaller opening in which blood can flow through) Calculating the mean electrical axis: look at the lead i ecg. This equals a : look at the lead i ecg. This equals b : add a plus b . Thiruvarangan negative value: do the same for the lead ii and ii. Overview of the pressure and volume changes in the cardiac cycle.