BIOC50H3 Lecture : lecture note 20 for BGYB50


LECTURE 20:
- Competition affects per capita survivorship, susceptibility to disease, and, very
predictably, body size and weight (Yoda’s Law: individual body weight and density are
correlated inversely; in a log-log plot of these parameters, a linear relationship is
frequently found, with a slope of -3/2; example: forest stands: trees are smaller when
there are many of them compared to only a few; conversely, if trees “want” to grow
larger, they will have to reduce their own density through self-thinning)
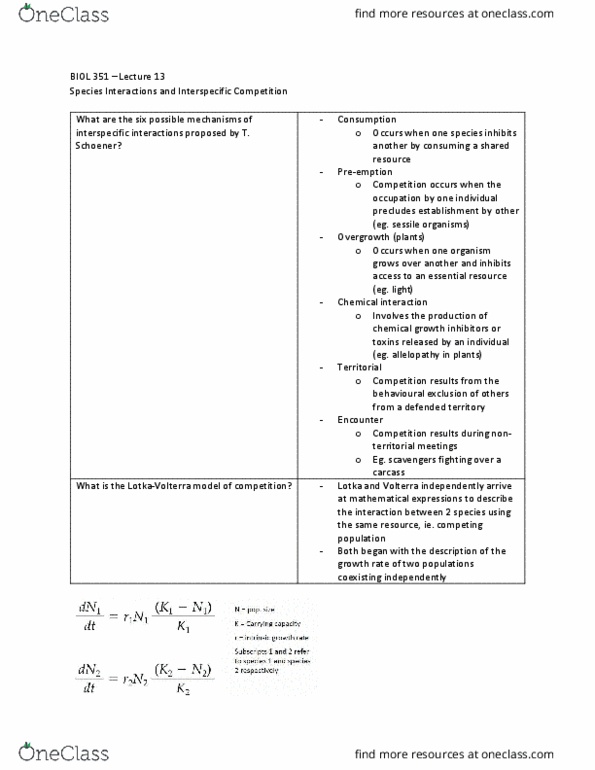
- In order to describe the competitive interactions between populations of two species, we
need to modify the logistic equations for those populations by incorporating the per
capita competitive effect (!) each has upon the other
- ! gives the relative “muscle power” of the two species populations in relation to each
other
- Subscripts to ! denote the directionality of the competition effect (!12 = the per capita
competitive effect on species 1 of species 2; !21 = the per capita competitive effect on
species 2 of species 1); e.g. !12 = 0.5, if the average individual in the population of
species 2 is half “as strong” as the average individual in the population of species 1; in
other words, multiplying N2 by !12 converts any given number of individuals of
population 2 to a number of “N1 equivalents”
- The logistic equations then become:
www.notesolution.com
Document Summary
In order to describe the competitive interactions between populations of two species, we need to modify the logistic equations for those populations by incorporating the per capita competitive effect () each has upon the other. gives the relative muscle power of the two species populations in relation to each other. These are known as the lotka-volterra equations for competition. Clearly, populations 1 and 2 will stop to grow when dn1/dt = 0, and dn2/dt = 0, respectively. The same can be done for species 2, and both lines (isoclines) and intercepts can be graphed in the same plot (which, by convention, has n1 as the x-axis and n2 as the y- axis) www. notesolution. com. The isoclines in these graphs delineate the areas where the numbers of populations 1 and 2 can increase (to the left of the respective isoclines) or have to decrease (to the right of the isoclines)