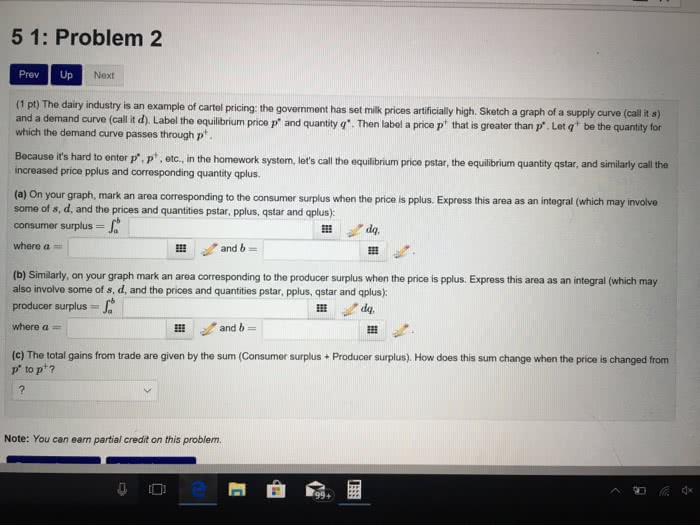
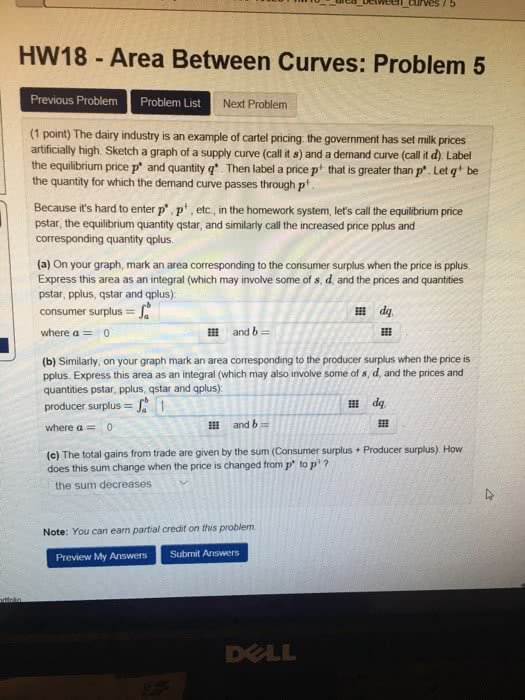
5 1: Problem 2 Prev Up Next dairy industry is an example of cartel pricing: the government has set milk prices artificially high. Sketch a graph of a supply curve (call i s) and a demand curve (call i d), Label the equilibrium price p' and quantity q'. Then label a price p that is greater than p. Let q be the quantity for which the demand curve passes through pt . Because its hard to enter p, pt, etc., in the homework system, let increased price pplus and corresponding quantity qplus. 's call h equltbrium price pstar, the equlibrium quanadsimilaly call he (a) On your graph, mark an area corresponding to the consumer surplus when the price is pplus. Express this area as an integral (which may involve some of s, d, and the prices and quantities pstar, pplus, qstar and qplus): consumer surplus where a and b = (b) Similarly, on your graph mark an area corresponding to the producer surplus when the price is pplus. Express this area as an integral (which may also involve some of s, d, and the prices and quantities pstar, pplus, qstar and qplus): producer surplus where a = and b (c) The total gains from trade are given by the sum (Consumer surplus p to p ? Producer surplus). How does this sum change when the price is changed from Note: You can earn partial credit on this problem. 99+