🏷️ LIMITED TIME OFFER: GET 20% OFF GRADE+ YEARLY SUBSCRIPTION →
Pricing
Log in
Sign up
Home
Homework Help
Study Guides
Class Notes
Textbook Notes
Textbook Solutions
Booster Classes
Blog
Home
Class Notes
1,200,000
CA
670,000
PSYA01H3 Lecture Notes - Lecture 2: Standard Deviation, Naturalistic Observation, Central Tendency
46
views
3
pages
skyrabbit493
24 Oct 2019
School
UTSC
Department
Psychology
Course
PSYA01H3
Professor
Steve Joordens
Like
For unlimited access to Class Notes, a
Class+
subscription is required.
Get access
Yearly
Monthly
Yearly
Grade+
20% off
$8
USD/m
$10 USD/m
Billed $96 USD annually
Homework Help
Study Guides
Textbook Solutions
Class Notes
Textbook Notes
Booster Class
40 Verified Answers
Class+
$8
USD/m
Billed $96 USD annually
Homework Help
Study Guides
Textbook Solutions
Class Notes
Textbook Notes
Booster Class
30 Verified Answers
Continue
Related Documents
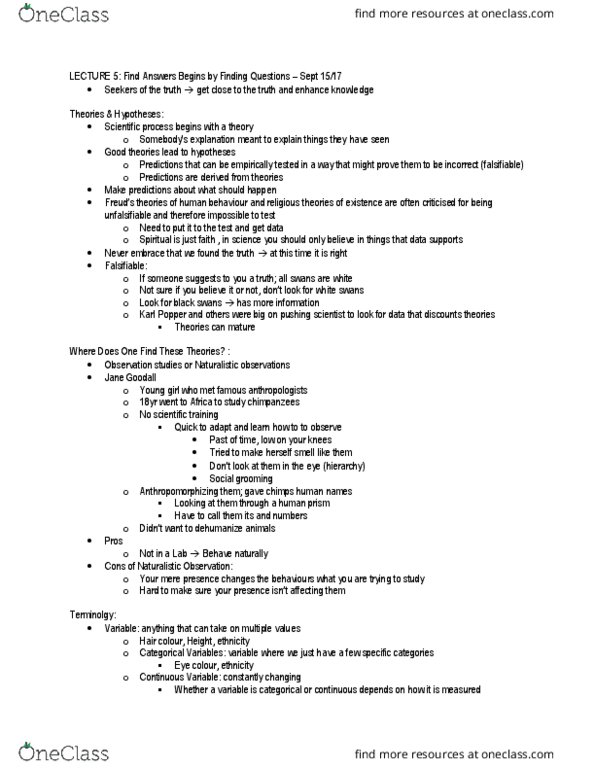
PSYA01H3 Lecture Notes - Lecture 5: Jane Goodall, Karl Popper, Social Grooming
ultramarinewildebeest251
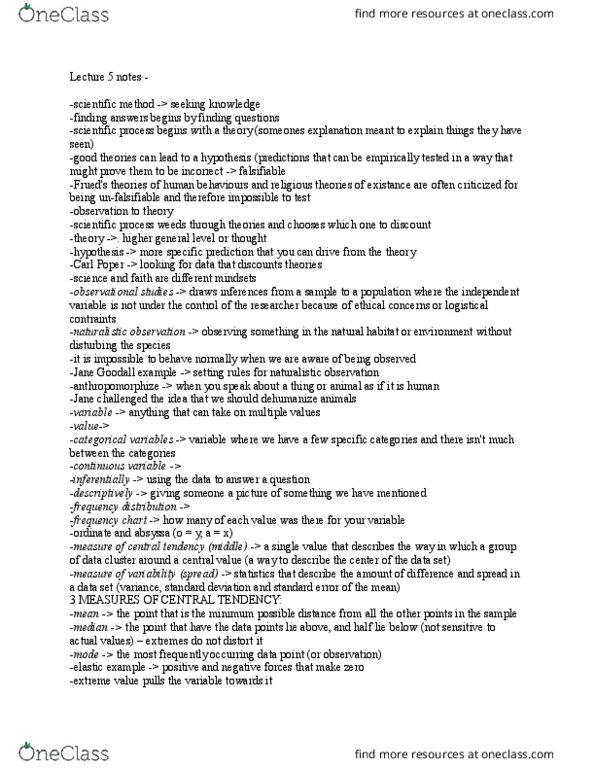
PSYA01H3 Lecture Notes - Lecture 5: Jane Goodall, Data Cluster, Naturalistic Observation
byzantiumdonkey40
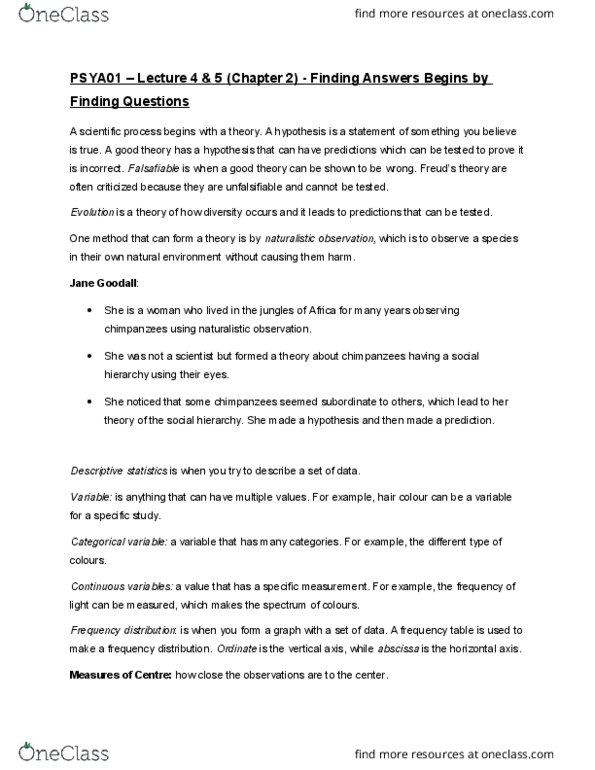
PSYA01H3 Lecture Notes - Lecture 4: Jane Goodall, Naturalistic Observation, Falsifiability
cyanprairie-dog251