PSYB07H3 Lecture Notes - Lecture 3: Kurtosis, Bar Chart, Skewness

Document Summary
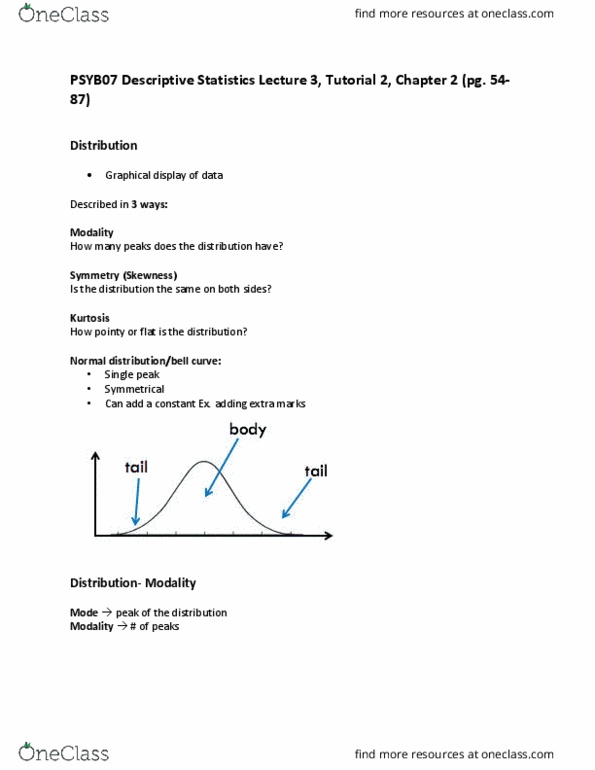
Basic concepts: population vs sample, random sampling & external validity, random assignment & internal validity. Variable: independent vs dependent, discrete vs continuous, measurement vs categorical, scale of measurement (nominal, ordinal, interval and ratio) Data representations: bar graph, histogram, stem-and-leaf plot. Normal distribution/bell curve: single peak, symmetrical. Bimodal (2 peaks: the modes may not be the same. Multimodal lots of modes, lots of peaks. Amodal (uniform) there really is no distribution. An asymmetric distribution is skewed: the body of the data is shifted to one side, one of the tails is longer than the other. The direction of skew is the direction that the tail is pointing (where the long end of the tail is) Mesokurtic is normal like the bellcurve. It gives us information about the shape of the distribution. The mode is the value corresponding to the peak of the distribution. Median is the midpoint of the distribution.