PSYB07H3 Lecture Notes - Lecture 3: Statistical Inference, Quartile, Descriptive Statistics


Document Summary
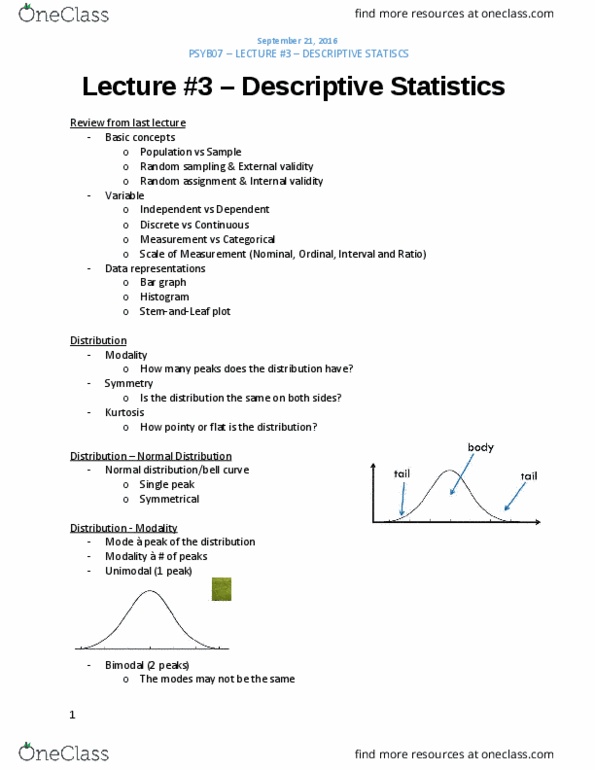
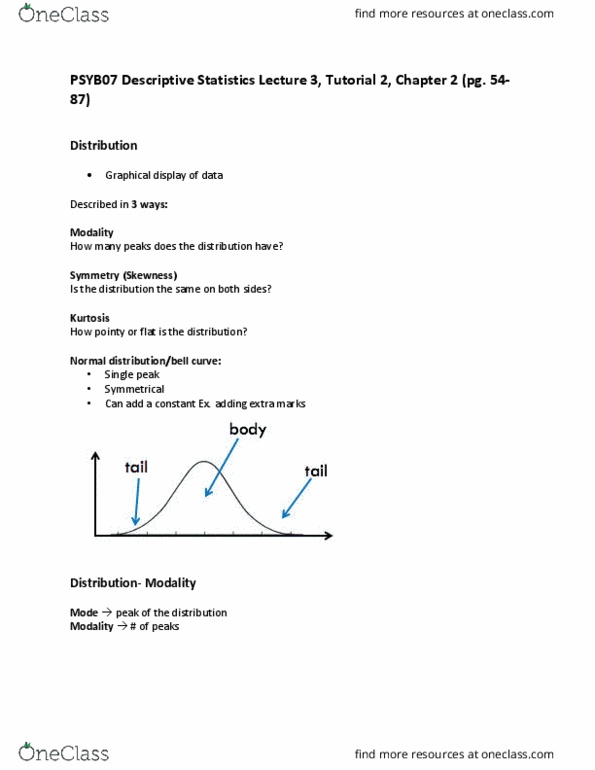
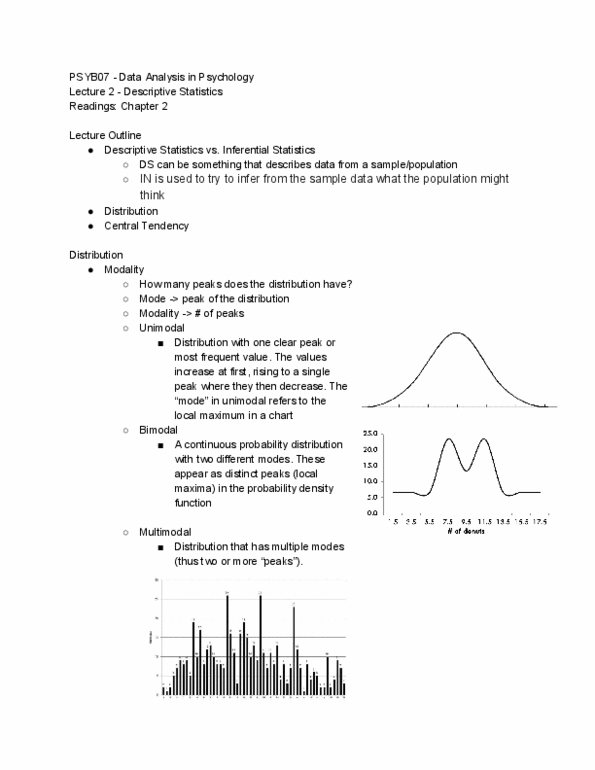
Modality refers to the number of peaks in a data set. Mode: the most frequent term in the data set (the peak of the distribution) Histogram first indication of the data. Smoothing the data (drawing the line over bars) gives a good indication of the distribution"s shape. Classic bell curve/ the normal distribution: tail, body, tail, generally a peak in the center and symmetrical sides, proportionate clustering of the data. Unimodal one peak or mode: common / normal, bell curve. Bimodal two peaks or modes: heights of peaks could the same or different. Multimodal more than two peaks or modes: appears messy, to be avoided, no pattern within the data. Amodal (uniform) distribution no peaks or modes: all values have the same frequency. Negatively skewed (towards left, or negative numbers) Refers to data clustering: how pointy or flat the shape of the distribution point, doesn"t affect measures central tendencies. But affects measures of spread or range.