PSYB07H3 Lecture 2: PSYB07 Lecture 2


PSYB07 - Data Analysis in Psychology
Lecture 2 - Descriptive Statistics
Readings: Chapter 2
Lecture Outline
● Descriptive Statistics vs. Inferential Statistics
○ DS can be something that describes data from a sample/population
○IN is used to try to infer from the sample data what the population might
think
● Distribution
● Central Tendency
Distribution
● Modality
○ How many peaks does the distribution have?
○ Mode -> peak of the distribution
○ Modality -> # of peaks
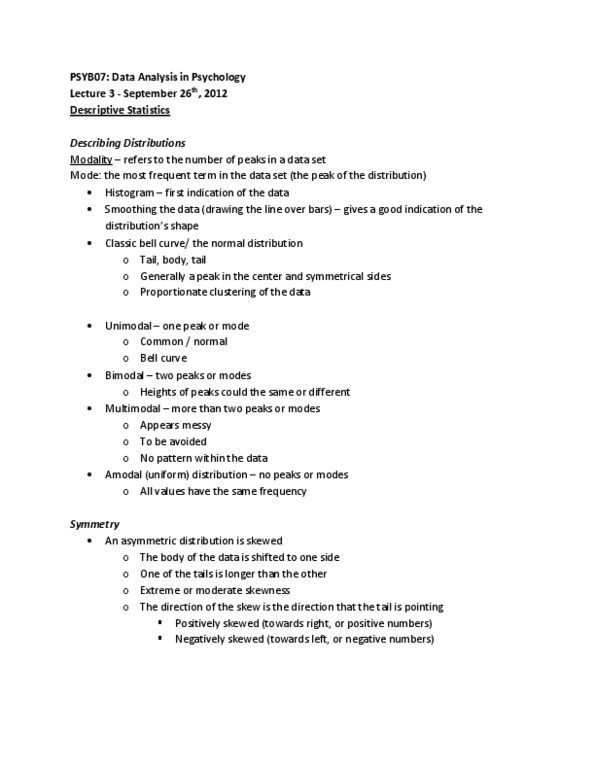
○ Unimodal
■ Distribution with one clear peak or
most frequent value. The values
increase at first, rising to a single
peak where they then decrease. The
“mode” in unimodal refers to the
local maximum in a chart
○ Bimodal
■ A continuous probability distribution
with two different modes. These
appear as distinct peaks (local
maxima) in the probability density
function
○ Multimodal
■ Distribution that has multiple modes
(thus two or more “peaks”).

○ Amodal (uniform)
○
● Symmetry
○ Is the distribution the same on both sides?
○ Skewness
■ Symmetrical vs. Asymmetrical
■ An asymmetrical distribution is skewed
● The body of the data is shifted to one side
● One of the tails is longer than the other
●
■ The direction of skew is the direction that the tail is pointing
■ Positively skewed
■
● Lots of the body is on the negative side
● E.g., when students do poorly in the class
■ Negatively Skewed
■
● Lots of the body is on the positive side
● E.g., when students do really well in the class

● Kurtosis
○ How pointy or flat is the distribution?
○ Kurtosis - how pointy or flat the shape of the distribution is
■ Where is the data clustered?
○ Need to know because it changes the analysis we need to use
○ Mesokurtic
■ Normal distribution
○
○ Platykurtic
○
○ Leptokurtic
○
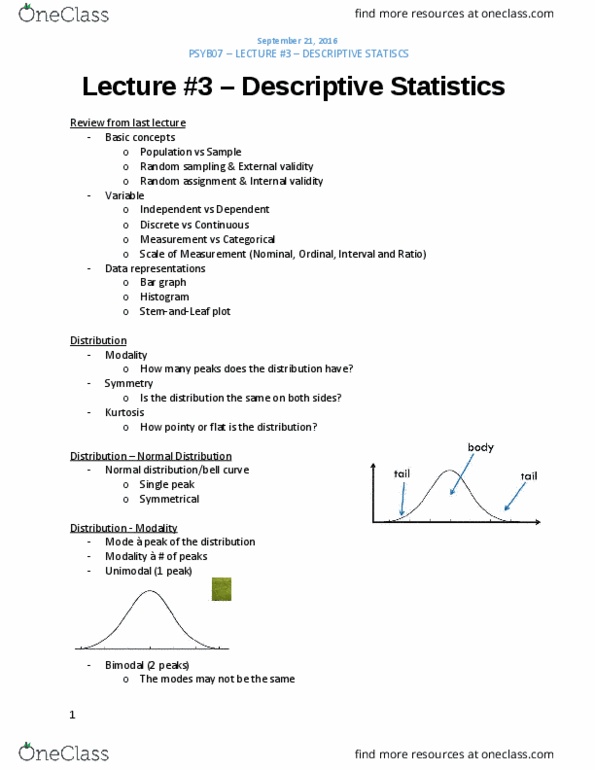
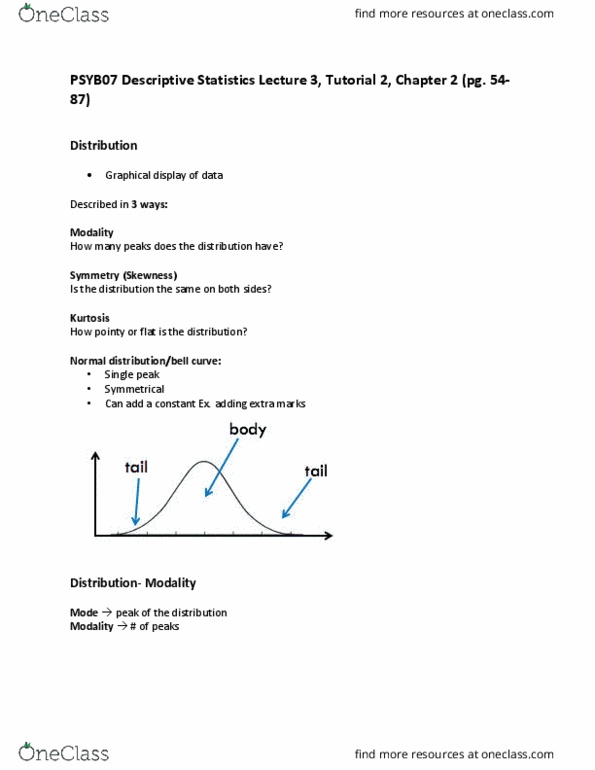
● Normal Distribution/Bell Curve
○ Single peak
○ Symmetrical
● The graph is telling us in respect to marks is that there is a little bit of people who did
really well (right side), a little bit of people who didn’t do so well (left side) and in the
middle is people who did averagely
Document Summary
Ds can be something that describes data from a sample/population. In is used to try to infer from the sample data what the population might think. Distribution with one clear peak or most frequent value. The values increase at first, rising to a single peak where they then decrease. Mode in unimodal refers to the local maximum in a chart. A continuous probability distribution with two different modes. These appear as distinct peaks (local maxima) in the probability density function. Distribution that has multiple modes (thus two or more peaks ). The body of the data is shifted to one side. One of the tails is longer than the other. The direction of skew is the direction that the tail is pointing. Lots of the body is on the negative side. E. g. , when students do poorly in the class. Lots of the body is on the positive side. E. g. , when students do really well in the class.